Loading
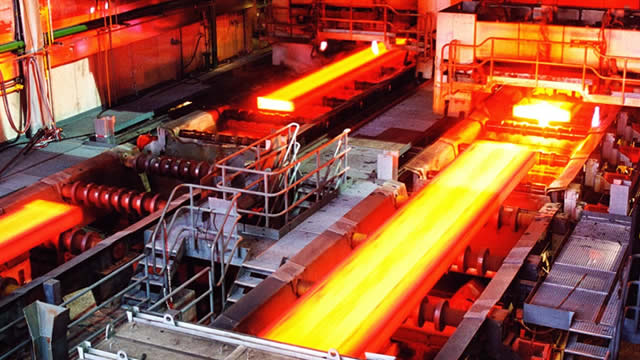
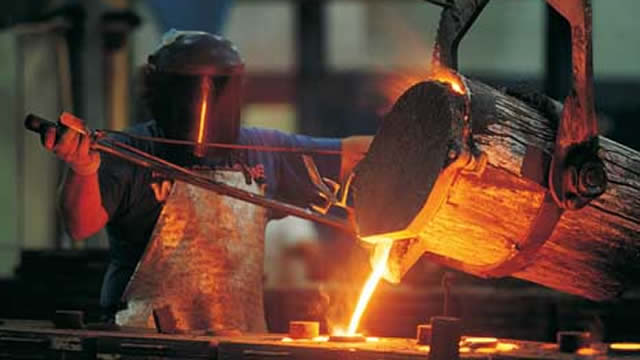
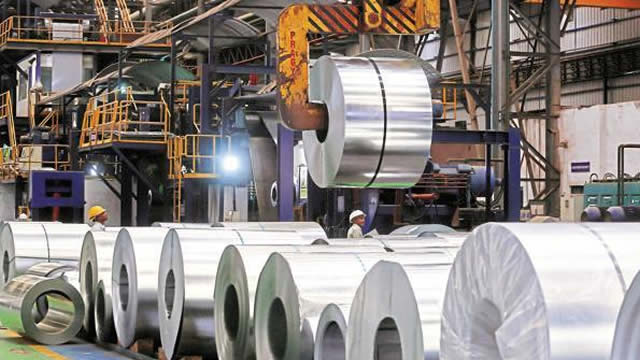
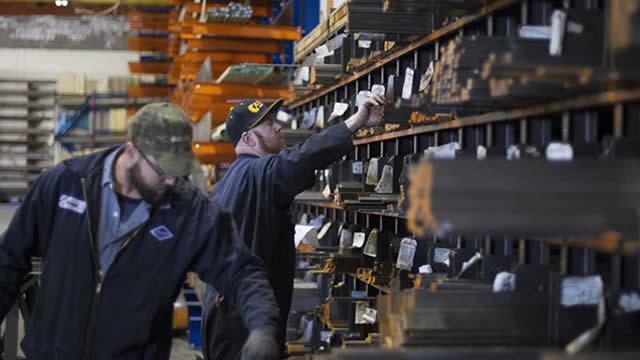
Nucor Corporation is a prominent producer and distributor of steel and diverse steel-related products. Within its Steel Mills division, the company manufactures a comprehensive range of steel goods. These include various sheet steel types like hot-rolled, cold-rolled, and galvanized, alongside plate steel. It also produces structural components such as wide-flange beams, beam blanks, H-piling, and sheet piling. Furthermore, this segment supplies bar steel products, encompassing blooms, billets, concrete reinforcing bars, merchant bars, and specialized bar quality items. Beyond manufacturing, Nucor's steel mills are involved in steel trading and the distribution of rebar. Its clientele primarily consists of steel service centers, fabricators, and manufacturers across the United States, Canada, and Mexico. The Steel Products segment provides an array of manufactured steel goods, such as hollow structural section tubing, electrical conduits, steel racking, joists and girders, steel decks, and fabricated concrete reinforcing steel. It also supplies cold finished steel, fasteners, complete metal building systems, insulated metal panels, steel grating, expanded metal, and various wire and wire mesh products. These offerings are largely directed towards nonresidential construction projects. Additionally, this segment manages a piling distribution operation. Nucor's Raw Materials division is responsible for producing direct reduced iron (DRI). It also acts as a broker for ferrous and nonferrous metals, pig iron, hot briquetted iron (HBI), and direct reduced iron (DRI). This segment supplies ferro-alloys, processes both ferrous and nonferrous scrap metals, and undertakes natural gas drilling activities. Its ferrous scrap is supplied to electric arc furnace steel mills and foundries for their manufacturing processes. Meanwhile, nonferrous scrap metal is sold to aluminum can manufacturers, secondary aluminum smelters, steel mills, various other processors, and direct consumers of diverse nonferrous metals. The corporation caters to a wide range of industries including agriculture, automotive, construction, energy and transmission, oil and gas, heavy equipment, infrastructure, and transportation. Sales are conducted via an in-house sales team and through the company's internal distribution and trading enterprises. Established in 1958, Nucor Corporation has its headquarters situated in Charlotte, North Carolina.
Previous close
$250.33
+$4.19 · +1.70%
Regular session · ET · Market data may be delayed.
Nucor Corporation is a prominent producer and distributor of steel and diverse steel-related products. Within its Steel Mills division, the company manufactures a comprehensive range of steel goods. These include various sheet steel types like hot-rolled, cold-rolled, and galvanized, alongside plate steel. It also produces structural components such as wide-flange beams, beam blanks, H-piling, and sheet piling. Furthermore, this segment supplies bar steel products, encompassing blooms, billets, concrete reinforcing bars, merchant bars, and specialized bar quality items. Beyond manufacturing, Nucor's steel mills are involved in steel trading and the distribution of rebar. Its clientele primarily consists of steel service centers, fabricators, and manufacturers across the United States, Canada, and Mexico. The Steel Products segment provides an array of manufactured steel goods, such as hollow structural section tubing, electrical conduits, steel racking, joists and girders, steel decks, and fabricated concrete reinforcing steel. It also supplies cold finished steel, fasteners, complete metal building systems, insulated metal panels, steel grating, expanded metal, and various wire and wire mesh products. These offerings are largely directed towards nonresidential construction projects. Additionally, this segment manages a piling distribution operation. Nucor's Raw Materials division is responsible for producing direct reduced iron (DRI). It also acts as a broker for ferrous and nonferrous metals, pig iron, hot briquetted iron (HBI), and direct reduced iron (DRI). This segment supplies ferro-alloys, processes both ferrous and nonferrous scrap metals, and undertakes natural gas drilling activities. Its ferrous scrap is supplied to electric arc furnace steel mills and foundries for their manufacturing processes. Meanwhile, nonferrous scrap metal is sold to aluminum can manufacturers, secondary aluminum smelters, steel mills, various other processors, and direct consumers of diverse nonferrous metals. The corporation caters to a wide range of industries including agriculture, automotive, construction, energy and transmission, oil and gas, heavy equipment, infrastructure, and transportation. Sales are conducted via an in-house sales team and through the company's internal distribution and trading enterprises. Established in 1958, Nucor Corporation has its headquarters situated in Charlotte, North Carolina.
Day range
Current $250.33
52-week range
Current $250.33
Regular session · ET · Market data may be delayed.
GoAI Score
Hold
Valuation
76
Undervalued
Sentiment
71
Bullish
Risk
43
Elevated Risk
Momentum
47
Neutral
Full GoAI research
Thesis, catalysts, evidence, and risk analysis.
Nucor Corporation is a prominent producer and distributor of steel and diverse steel-related products. Within its Steel Mills division, the company manufactures a comprehensive range of steel goods. These include various sheet steel types like hot-rolled, cold-rolled, and galvanized, alongside plate steel. It also produces structural components such as wide-flange beams, beam blanks, H-piling, and sheet piling. Furthermore, this segment supplies bar steel products, encompassing blooms, billets, concrete reinforcing bars, merchant bars, and specialized bar quality items. Beyond manufacturing, Nucor's steel mills are involved in steel trading and the distribution of rebar. Its clientele primarily consists of steel service centers, fabricators, and manufacturers across the United States, Canada, and Mexico. The Steel Products segment provides an array of manufactured steel goods, such as hollow structural section tubing, electrical conduits, steel racking, joists and girders, steel decks, and fabricated concrete reinforcing steel. It also supplies cold finished steel, fasteners, complete metal building systems, insulated metal panels, steel grating, expanded metal, and various wire and wire mesh products. These offerings are largely directed towards nonresidential construction projects. Additionally, this segment manages a piling distribution operation. Nucor's Raw Materials division is responsible for producing direct reduced iron (DRI). It also acts as a broker for ferrous and nonferrous metals, pig iron, hot briquetted iron (HBI), and direct reduced iron (DRI). This segment supplies ferro-alloys, processes both ferrous and nonferrous scrap metals, and undertakes natural gas drilling activities. Its ferrous scrap is supplied to electric arc furnace steel mills and foundries for their manufacturing processes. Meanwhile, nonferrous scrap metal is sold to aluminum can manufacturers, secondary aluminum smelters, steel mills, various other processors, and direct consumers of diverse nonferrous metals. The corporation caters to a wide range of industries including agriculture, automotive, construction, energy and transmission, oil and gas, heavy equipment, infrastructure, and transportation. Sales are conducted via an in-house sales team and through the company's internal distribution and trading enterprises. Established in 1958, Nucor Corporation has its headquarters situated in Charlotte, North Carolina.
Day range
Current $250.33
52-week range
Current $250.33
Profitability as a percentage of reported revenue.
Revenue
Operating income
Net income
| Metric (USD) | FY2025 | FY2024 | FY2023 | FY2022 | FY2021 |
|---|---|---|---|---|---|
| Revenue | 32.49B USD | 30.73B USD | 34.71B USD | 41.51B USD | 36.48B USD |
| Cost of goods sold | 28.62B USD | 26.63B USD | 26.9B USD | 29.01B USD | 25.46B USD |
| Gross profit | 3.88B USD | 4.1B USD | 7.82B USD | 12.5B USD | 11.03B USD |
| Selling, general, and administrative | 1.22B USD | 1.12B USD | 1.59B USD | 2B USD | 1.71B USD |
| Operating expenses | 1.22B USD | 1.12B USD | 1.59B USD | 2B USD | 1.71B USD |
| Interest income | 111M USD | 258M USD | 276M USD | 48.7M USD | 4.27M USD |
| Interest expense | 170M USD | 228M USD | 246M USD | 218.91M USD | 163.12M USD |
| Depreciation and amortization | 1.48B USD | 1.36B USD | 1.17B USD | 1.06B USD | 864.56M USD |
| Operating income | 2.66B USD | 2.98B USD | 6.23B USD | 10.51B USD | 9.32B USD |
| Net income | 1.74B USD | 2.03B USD | 4.52B USD | 7.61B USD | 6.83B USD |
Company facts updated Oct 11, 2026.
Recent quarterly results
Recent quarterly results
Third-party consensus; not a GoAI recommendation.
Average target
$266.88
6.61% upsideCash distributions grouped by calendar year; partial years are marked.
$2.21
2025 complete year+28.9% since 2021
2026 partial: $1.68
$1.715
2,021
$2.01
2,022
$2.07
2,023
$2.17
2,024
$2.21
2,025
$1.68
2,026*
* Partial calendar year in the available dividend history.
| Action | Ex-dividend date | Details | Record date | Payment date |
|---|---|---|---|---|
Dividend | Sep 30, 2026 | $0.56Quarterly | Sep 30, 2026 | Nov 10, 2026 |
Dividend | Jun 30, 2026 | $0.56Quarterly | Jun 30, 2026 | Aug 11, 2026 |
Dividend | Mar 31, 2026 | $0.56Quarterly | Mar 31, 2026 | May 11, 2026 |
Dividend | Dec 31, 2025 | $0.56Quarterly | Dec 31, 2025 | Feb 11, 2026 |
Dividend | Sep 30, 2025 | $0.55Quarterly | Sep 30, 2025 | Nov 10, 2025 |
Dividend | Jun 30, 2025 | $0.55Quarterly | Jun 30, 2025 | Aug 11, 2025 |
Ex-dividend Sep 30, 2026
$0.56
Quarterly
Record Sep 30, 2026 · Payment Nov 10, 2026
Ex-dividend Jun 30, 2026
$0.56
Quarterly
Record Jun 30, 2026 · Payment Aug 11, 2026
Ex-dividend Mar 31, 2026
$0.56
Quarterly
Record Mar 31, 2026 · Payment May 11, 2026
Ex-dividend Dec 31, 2025
$0.56
Quarterly
Record Dec 31, 2025 · Payment Feb 11, 2026
Ex-dividend Sep 30, 2025
$0.55
Quarterly
Record Sep 30, 2025 · Payment Nov 10, 2025
Ex-dividend Jun 30, 2025
$0.55
Quarterly
Record Jun 30, 2025 · Payment Aug 11, 2025
Funds reporting this stock among their holdings, ordered by reported position size.
 State Street SPDR S&P 500 ETF1557.T107.67B0.08%129.35T JPY0.09%¥122,850+0.12%
 Vanguard Morningstar Total Stock Market ETFVTI1.81B0.08%2.3T USD0.03%$381.94+0.63%
 Vanguard S&P 500 ETFVOO1.51B0.09%1.8T USD0.03%$715.59+0.61%
 Vanguard Morningstar Mid-Cap ETFVO1.23B0.54%226.4B USD0.03%$81.14+0.92%
 iShares Core S&P 500 ETFIVV742.45M0.08%896.44B USD0.03%$781.97+0.60%
 State Street SPDR S&P 500 ETFSPY680.22M0.08%817.2B USD0.09%$778.57+0.60%
 Vanguard Morningstar Value ETFVTV543.12M0.21%262.4B USD0.03%$220.59+0.44%
 Global X - U.S. Infrastructure Development ETFPAVE457.82M3.35%13.67B USD0.47%$53.45+0.38%State Street SPDR S&P 500 ETF1557.TVanguard Morningstar Total Stock Market ETFVTIVanguard S&P 500 ETFVOOVanguard Morningstar Mid-Cap ETFVOiShares Core S&P 500 ETFIVVState Street SPDR S&P 500 ETFSPYVanguard Morningstar Value ETFVTVGlobal X - U.S. Infrastructure Development ETFPAVE
AI-generated and delayed market data for informational and educational purposes only. Not investment advice.