Loading

NASDAQReal EstateREIT - Retail
Latest quote
$37.57
+$0.18 · +0.48%
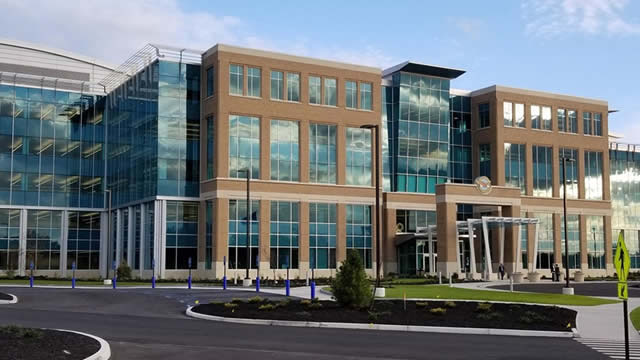
Phillips Edison & Company, Inc. is one of the nation’s largest owners and operators of high-quality, grocery-anchored neighborhood shopping centers. PECO has generated strong results through its vertically integrated operating platform and national footprint of well-occupied shopping centers. PECO’s centers feature a mix of national and regional retailers providing necessity-based goods and services in fundamentally strong markets throughout the United States. PECO’s top grocery anchors include Kroger, Publix, Albertsons and Ahold Delhaize. As of December 31, 2025, PECO managed 324 shopping centers, including 297 wholly owned centers comprising 33.5 million square feet across 31 states and 27 shopping centers owned in three institutional joint ventures. PECO is focused on creating great omni-channel, grocery-anchored shopping experiences and improving communities, one neighborhood shopping center at a time. Phillips Edison & Company, Inc. was incorporated in 1991.
Previous close
$37.57
+$0.18 · +0.48%
Regular session · ET · Market data may be delayed.
Phillips Edison & Company, Inc. is one of the nation’s largest owners and operators of high-quality, grocery-anchored neighborhood shopping centers. PECO has generated strong results through its vertically integrated operating platform and national footprint of well-occupied shopping centers. PECO’s centers feature a mix of national and regional retailers providing necessity-based goods and services in fundamentally strong markets throughout the United States. PECO’s top grocery anchors include Kroger, Publix, Albertsons and Ahold Delhaize. As of December 31, 2025, PECO managed 324 shopping centers, including 297 wholly owned centers comprising 33.5 million square feet across 31 states and 27 shopping centers owned in three institutional joint ventures. PECO is focused on creating great omni-channel, grocery-anchored shopping experiences and improving communities, one neighborhood shopping center at a time. Phillips Edison & Company, Inc. was incorporated in 1991.
Day range
Current $37.57
52-week range
Current $37.57
Regular session · ET · Market data may be delayed.
GoAI Score
Hold
Valuation
55
Fair Value
Sentiment
65
Bullish
Risk
16
Low Risk
Momentum
53
Neutral
Full GoAI research
Thesis, catalysts, evidence, and risk analysis.
Phillips Edison & Company, Inc. is one of the nation’s largest owners and operators of high-quality, grocery-anchored neighborhood shopping centers. PECO has generated strong results through its vertically integrated operating platform and national footprint of well-occupied shopping centers. PECO’s centers feature a mix of national and regional retailers providing necessity-based goods and services in fundamentally strong markets throughout the United States. PECO’s top grocery anchors include Kroger, Publix, Albertsons and Ahold Delhaize. As of December 31, 2025, PECO managed 324 shopping centers, including 297 wholly owned centers comprising 33.5 million square feet across 31 states and 27 shopping centers owned in three institutional joint ventures. PECO is focused on creating great omni-channel, grocery-anchored shopping experiences and improving communities, one neighborhood shopping center at a time. Phillips Edison & Company, Inc. was incorporated in 1991.
Day range
Current $37.57
52-week range
Current $37.57
Profitability as a percentage of reported revenue.
Revenue
Operating income
Net income
| Metric (USD) | FY2025 | FY2024 | FY2023 | FY2022 | FY2021 |
|---|---|---|---|---|---|
| Revenue | 732.3M USD | 661.39M USD | 610.12M USD | 575.37M USD | 532.85M USD |
| Cost of goods sold | 742.48M USD | 190.32M USD | 175.12M USD | 163.22M USD | 158.3M USD |
| Gross profit | −10.19M USD | 471.08M USD | 435.01M USD | 412.15M USD | 374.55M USD |
| Selling, general, and administrative | 51.64M USD | 45.61M USD | 44.37M USD | 45.24M USD | 48.82M USD |
| Operating expenses | −209.03M USD | 45.61M USD | 44.37M USD | 45.24M USD | 48.82M USD |
| Interest expense | 110.25M USD | 95.7M USD | 83.86M USD | 71.2M USD | 76.37M USD |
| Depreciation and amortization | 257.73M USD | 246.43M USD | 231.27M USD | 231.9M USD | 217.85M USD |
| Operating income | 198.85M USD | 425.46M USD | 390.64M USD | 366.91M USD | 325.73M USD |
| Net income | 111.3M USD | 62.69M USD | 56.85M USD | 48.32M USD | 15.12M USD |
Company facts updated Oct 11, 2026.
Recent quarterly results
Recent quarterly results
Third-party consensus; not a GoAI recommendation.
Average target
$43.14
14.83% upsideCash distributions grouped by calendar year; partial years are marked.
$1.2532
2025 complete year+14.7% since 2022
2026 partial: $0.9814
$1.0923
2,022
$1.1361
2,023
$1.19
2,024
$1.2532
2,025
$0.9814
2,026*
* Partial calendar year in the available dividend history.
| Action | Ex-dividend date | Details | Record date | Payment date |
|---|---|---|---|---|
DividendUpcoming | Oct 15, 2026 | $0.115Monthly | Oct 15, 2026 | Nov 3, 2026 |
DividendUpcoming | Nov 16, 2026 | $0.115Monthly | Nov 16, 2026 | Dec 1, 2026 |
Dividend | Sep 15, 2026 | $0.115Monthly | Sep 15, 2026 | Oct 1, 2026 |
Dividend | Aug 17, 2026 | $0.1083Monthly | Aug 17, 2026 | Sep 1, 2026 |
Dividend | Jul 15, 2026 | $0.1083Monthly | Jul 15, 2026 | Aug 4, 2026 |
Dividend | Jun 15, 2026 | $0.1083Monthly | Jun 15, 2026 | Jul 1, 2026 |
Ex-dividend Oct 15, 2026
$0.115
Monthly
Record Oct 15, 2026 · Payment Nov 3, 2026
Ex-dividend Nov 16, 2026
$0.115
Monthly
Record Nov 16, 2026 · Payment Dec 1, 2026
Ex-dividend Sep 15, 2026
$0.115
Monthly
Record Sep 15, 2026 · Payment Oct 1, 2026
Ex-dividend Aug 17, 2026
$0.1083
Monthly
Record Aug 17, 2026 · Payment Sep 1, 2026
Ex-dividend Jul 15, 2026
$0.1083
Monthly
Record Jul 15, 2026 · Payment Aug 4, 2026
Ex-dividend Jun 15, 2026
$0.1083
Monthly
Record Jun 15, 2026 · Payment Jul 1, 2026
AI-generated and delayed market data for informational and educational purposes only. Not investment advice.