Loading

NYSEConsumer DefensiveTobacco
Latest quote
$201.19
+$0.69 · +0.34%
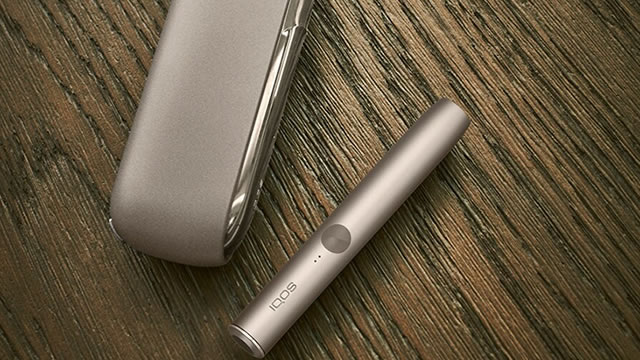
Philip Morris International Inc. functions as a prominent tobacco enterprise, actively working toward a smoke-free future. The company is strategically diversifying its long-term product range to incorporate items beyond traditional tobacco and nicotine. Its primary business involves both conventional cigarettes and an expanding array of smoke-free alternatives, such as innovative heat-not-burn devices, vapor products, and oral nicotine solutions. These offerings are distributed in markets worldwide, with the exception of the United States. The smoke-free portfolio includes brands like HEETS (encompassing Creations, Dimensions, Marlboro variants), Parliament HeatSticks, and TEREA, in addition to KT&G-licensed brands Fiit and Miix. For conventional cigarettes, the company sells internationally recognized brands such as Marlboro, Parliament, Bond Street, Chesterfield, L&M, Lark, and Philip Morris. Regionally, it also owns major cigarette brands like Dji Sam Soe, Sampoerna A, and Sampoerna U in Indonesia, and Fortune and Jackpot in the Philippines. PMI's smoke-free innovations are currently available across 71 global markets. Established in 1987, Philip Morris International Inc. is headquartered in New York, New York.
Previous close
$201.19
+$0.69 · +0.34%
Regular session · ET · Market data may be delayed.
Philip Morris International Inc. functions as a prominent tobacco enterprise, actively working toward a smoke-free future. The company is strategically diversifying its long-term product range to incorporate items beyond traditional tobacco and nicotine. Its primary business involves both conventional cigarettes and an expanding array of smoke-free alternatives, such as innovative heat-not-burn devices, vapor products, and oral nicotine solutions. These offerings are distributed in markets worldwide, with the exception of the United States. The smoke-free portfolio includes brands like HEETS (encompassing Creations, Dimensions, Marlboro variants), Parliament HeatSticks, and TEREA, in addition to KT&G-licensed brands Fiit and Miix. For conventional cigarettes, the company sells internationally recognized brands such as Marlboro, Parliament, Bond Street, Chesterfield, L&M, Lark, and Philip Morris. Regionally, it also owns major cigarette brands like Dji Sam Soe, Sampoerna A, and Sampoerna U in Indonesia, and Fortune and Jackpot in the Philippines. PMI's smoke-free innovations are currently available across 71 global markets. Established in 1987, Philip Morris International Inc. is headquartered in New York, New York.
Day range
Current $201.19
52-week range
Current $201.19
Regular session · ET · Market data may be delayed.
GoAI Score
Buy
Valuation
59
Fair Value
Sentiment
66
Bullish
Risk
17
Low Risk
Momentum
51
Neutral
Full GoAI research
Thesis, catalysts, evidence, and risk analysis.
Philip Morris International Inc. functions as a prominent tobacco enterprise, actively working toward a smoke-free future. The company is strategically diversifying its long-term product range to incorporate items beyond traditional tobacco and nicotine. Its primary business involves both conventional cigarettes and an expanding array of smoke-free alternatives, such as innovative heat-not-burn devices, vapor products, and oral nicotine solutions. These offerings are distributed in markets worldwide, with the exception of the United States. The smoke-free portfolio includes brands like HEETS (encompassing Creations, Dimensions, Marlboro variants), Parliament HeatSticks, and TEREA, in addition to KT&G-licensed brands Fiit and Miix. For conventional cigarettes, the company sells internationally recognized brands such as Marlboro, Parliament, Bond Street, Chesterfield, L&M, Lark, and Philip Morris. Regionally, it also owns major cigarette brands like Dji Sam Soe, Sampoerna A, and Sampoerna U in Indonesia, and Fortune and Jackpot in the Philippines. PMI's smoke-free innovations are currently available across 71 global markets. Established in 1987, Philip Morris International Inc. is headquartered in New York, New York.
Day range
Current $201.19
52-week range
Current $201.19
Profitability as a percentage of reported revenue.
Revenue
Operating income
Net income
| Metric (USD) | FY2025 | FY2024 | FY2023 | FY2022 | FY2021 |
|---|---|---|---|---|---|
| Revenue | 40.65B USD | 37.88B USD | 35.17B USD | 31.76B USD | 31.41B USD |
| Cost of goods sold | 13.37B USD | 13.33B USD | 12.89B USD | 11.4B USD | 10.03B USD |
| Gross profit | 27.28B USD | 24.55B USD | 22.28B USD | 20.36B USD | 21.38B USD |
| Research and development | 756M USD | 759M USD | — | — | 617M USD |
| Selling, general, and administrative | 10.56B USD | 11.15B USD | 10.06B USD | 8.11B USD | 8.4B USD |
| Operating expenses | 12.39B USD | 11.15B USD | 10.73B USD | 8.11B USD | 8.4B USD |
| Interest income | 621M USD | 620M USD | 465M USD | 180M USD | 109M USD |
| Interest expense | 1.59B USD | 1.76B USD | 1.53B USD | 768M USD | 737M USD |
| Depreciation and amortization | 2B USD | 1.79B USD | 1.4B USD | 1.08B USD | 998M USD |
| Operating income | 14.89B USD | 13.4B USD | 11.56B USD | 12.25B USD | 12.97B USD |
| Net income | 11.35B USD | 7.03B USD | 7.79B USD | 9.05B USD | 9.11B USD |
Company facts updated Oct 11, 2026.
Recent quarterly results
Recent quarterly results
Third-party consensus; not a GoAI recommendation.
Average target
$212.17
5.46% upsideCash distributions grouped by calendar year; partial years are marked.
$5.64
2025 complete year+15.1% since 2021
2026 partial: $4.54
$4.90
2,021
$5.04
2,022
$5.14
2,023
$5.30
2,024
$5.64
2,025
$4.54
2,026*
* Partial calendar year in the available dividend history.
| Action | Ex-dividend date | Details | Record date | Payment date |
|---|---|---|---|---|
Dividend | Oct 2, 2026 | $1.60Quarterly | Oct 2, 2026 | Oct 26, 2026 |
Dividend | Jun 25, 2026 | $1.47Quarterly | Jun 25, 2026 | Jul 20, 2026 |
Dividend | Mar 19, 2026 | $1.47Quarterly | Mar 19, 2026 | Apr 13, 2026 |
Dividend | Dec 26, 2025 | $1.47Irregular | Dec 26, 2025 | Jan 14, 2026 |
Dividend | Oct 3, 2025 | $1.47Quarterly | Oct 3, 2025 | Oct 20, 2025 |
Dividend | Jun 27, 2025 | $1.35Quarterly | Jun 27, 2025 | Jul 15, 2025 |
Ex-dividend Oct 2, 2026
$1.60
Quarterly
Record Oct 2, 2026 · Payment Oct 26, 2026
Ex-dividend Jun 25, 2026
$1.47
Quarterly
Record Jun 25, 2026 · Payment Jul 20, 2026
Ex-dividend Mar 19, 2026
$1.47
Quarterly
Record Mar 19, 2026 · Payment Apr 13, 2026
Ex-dividend Dec 26, 2025
$1.47
Irregular
Record Dec 26, 2025 · Payment Jan 14, 2026
Ex-dividend Oct 3, 2025
$1.47
Quarterly
Record Oct 3, 2025 · Payment Oct 20, 2025
Ex-dividend Jun 27, 2025
$1.35
Quarterly
Record Jun 27, 2025 · Payment Jul 15, 2025
Funds reporting this stock among their holdings, ordered by reported position size.
 State Street SPDR S&P 500 ETF1557.T604.42B0.47%129.35T JPY0.09%¥122,850+0.12%
 Vanguard Morningstar Total Stock Market ETFVTI9.28B0.40%2.3T USD0.03%$381.94+0.63%
 Vanguard S&P 500 ETFVOO7.76B0.44%1.8T USD0.03%$715.59+0.61%
 iShares Core S&P 500 ETFIVV4.15B0.47%896.44B USD0.03%$781.97+0.60%
 State Street SPDR S&P 500 ETFSPY3.82B0.47%817.2B USD0.09%$778.57+0.60%
 Vanguard Morningstar Value ETFVTV2.79B1.06%262.4B USD0.03%$220.59+0.44%
 Vanguard High Dividend Yield ETFVYM1.18B1.17%100.8B USD0.04%$158.75+0.32%
 iShares Core Dividend Growth ETFDGRO983.74M2.30%43.08B USD0.08%$77.29+0.53%State Street SPDR S&P 500 ETF1557.TVanguard Morningstar Total Stock Market ETFVTIVanguard S&P 500 ETFVOOiShares Core S&P 500 ETFIVVState Street SPDR S&P 500 ETFSPYVanguard Morningstar Value ETFVTVVanguard High Dividend Yield ETFVYMiShares Core Dividend Growth ETFDGRO
AI-generated and delayed market data for informational and educational purposes only. Not investment advice.