
Loading
NASDAQFinancial ServicesFinancial - Credit Services
Latest quote
$25.54
+$0.54 · +2.16%
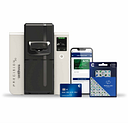
CPI Card Group Inc., along with its affiliated entities, specializes in the full spectrum of financial payment card services. This includes everything from the initial design and manufacturing to the personalized data integration, secure packaging, and final distribution of these cards. The company operates through two primary divisions: Debit and Credit, and Prepaid Debit. The Debit and Credit segment is responsible for producing various financial payment cards, such as those adhering to Europay, Mastercard, and Visa (EMV) standards, as well as non-EMV cards, premium metal cards, and custom private label credit cards. It also delivers extensive card-related services to financial institutions that issue cards. These services encompass on-demand solutions, individualizing cards with specific user data, managing fulfillment processes, and offering immediate card issuance capabilities. The Prepaid Debit segment focuses on providing integrated card services, notably secure, tamper-evident packaging, to suppliers of prepaid debit cards. Furthermore, this division manufactures financial payment cards that are issued under the major payment network brands. CPI Card Group serves a broad range of clients across the United States. Its customers include issuers of both debit and credit cards, administrators of Prepaid Debit Card programs, local community banks, credit unions, collective service providers, and companies involved in processing card transactions. Originally established in 2007, the company was known as CPI Holdings I, Inc. It subsequently adopted its current name, CPI Card Group Inc., in August 2015. The corporate headquarters are situated in Littleton, Colorado.
Previous close
$25.54
+$0.54 · +2.16%
Regular session · ET · Market data may be delayed.
CPI Card Group Inc., along with its affiliated entities, specializes in the full spectrum of financial payment card services. This includes everything from the initial design and manufacturing to the personalized data integration, secure packaging, and final distribution of these cards. The company operates through two primary divisions: Debit and Credit, and Prepaid Debit. The Debit and Credit segment is responsible for producing various financial payment cards, such as those adhering to Europay, Mastercard, and Visa (EMV) standards, as well as non-EMV cards, premium metal cards, and custom private label credit cards. It also delivers extensive card-related services to financial institutions that issue cards. These services encompass on-demand solutions, individualizing cards with specific user data, managing fulfillment processes, and offering immediate card issuance capabilities. The Prepaid Debit segment focuses on providing integrated card services, notably secure, tamper-evident packaging, to suppliers of prepaid debit cards. Furthermore, this division manufactures financial payment cards that are issued under the major payment network brands. CPI Card Group serves a broad range of clients across the United States. Its customers include issuers of both debit and credit cards, administrators of Prepaid Debit Card programs, local community banks, credit unions, collective service providers, and companies involved in processing card transactions. Originally established in 2007, the company was known as CPI Holdings I, Inc. It subsequently adopted its current name, CPI Card Group Inc., in August 2015. The corporate headquarters are situated in Littleton, Colorado.
Day range
Current $25.54
52-week range
Current $25.54
Regular session · ET · Market data may be delayed.
GoAI Score
Hold
Valuation
49
Fair Value
Sentiment
70
Bullish
Risk
52
Elevated Risk
Momentum
64
Gaining
Full GoAI research
Thesis, catalysts, evidence, and risk analysis.
CPI Card Group Inc., along with its affiliated entities, specializes in the full spectrum of financial payment card services. This includes everything from the initial design and manufacturing to the personalized data integration, secure packaging, and final distribution of these cards. The company operates through two primary divisions: Debit and Credit, and Prepaid Debit. The Debit and Credit segment is responsible for producing various financial payment cards, such as those adhering to Europay, Mastercard, and Visa (EMV) standards, as well as non-EMV cards, premium metal cards, and custom private label credit cards. It also delivers extensive card-related services to financial institutions that issue cards. These services encompass on-demand solutions, individualizing cards with specific user data, managing fulfillment processes, and offering immediate card issuance capabilities. The Prepaid Debit segment focuses on providing integrated card services, notably secure, tamper-evident packaging, to suppliers of prepaid debit cards. Furthermore, this division manufactures financial payment cards that are issued under the major payment network brands. CPI Card Group serves a broad range of clients across the United States. Its customers include issuers of both debit and credit cards, administrators of Prepaid Debit Card programs, local community banks, credit unions, collective service providers, and companies involved in processing card transactions. Originally established in 2007, the company was known as CPI Holdings I, Inc. It subsequently adopted its current name, CPI Card Group Inc., in August 2015. The corporate headquarters are situated in Littleton, Colorado.
Day range
Current $25.54
52-week range
Current $25.54
Profitability as a percentage of reported revenue.
Revenue
Operating income
Net income
| Metric (USD) | FY2025 | FY2024 | FY2023 | FY2022 | FY2021 |
|---|---|---|---|---|---|
| Revenue | 543.53M USD | 480.6M USD | 444.55M USD | 475.75M USD | 375.12M USD |
| Cost of goods sold | 373.44M USD | 309.38M USD | 289.06M USD | 299.98M USD | 233.69M USD |
| Gross profit | 170.1M USD | 171.22M USD | 155.49M USD | 175.77M USD | 141.43M USD |
| Selling, general, and administrative | 115.26M USD | 103.4M USD | 88.26M USD | 90.78M USD | 75.7M USD |
| Operating expenses | 115.26M USD | 108.43M USD | 93.9M USD | 96.64M USD | 81.96M USD |
| Interest expense | 32.47M USD | 34.09M USD | 26.91M USD | 29.62M USD | 30.61M USD |
| Depreciation and amortization | 22.46M USD | 16.42M USD | 15.93M USD | 14.89M USD | 15.1M USD |
| Operating income | 54.84M USD | 62.79M USD | 61.59M USD | 79.13M USD | 59.46M USD |
| Net income | 14.95M USD | 19.52M USD | 23.99M USD | 36.54M USD | 15.94M USD |
Company facts updated Oct 10, 2026.
Recent quarterly results
Recent quarterly results
Third-party consensus; not a GoAI recommendation.
Funds reporting this stock among their holdings, ordered by reported position size.
 iShares Russell 2000 ETFIWM5.59M0.01%78.27B USD0.19%$278.94+0.49%
 Vanguard Morningstar Total Stock Market ETFVTI5.32M0.00%2.3T USD0.03%$381.94+0.63%
 Vanguard Information Technology ETFVGT4.37M0.00%170.2B USD0.09%$127.98+0.57%
 Inspire Fidelis Multi Factor ETFFDLS2.58M1.03%249.71M USD0.66%$42.23+0.67%
 Vanguard Extended Market ETFVXF2.11M0.00%95.4B USD0.05%$235+0.80%
 iShares Russell 2000 Growth ETFIWO1.85M0.01%13.97B USD0.24%$356.78+0.94%
 Vanguard Russell 2000 ETFVTWO1.33M0.01%18B USD0.06%$112.66+0.50%
 iShares Micro-Cap ETFIWC624.6K0.05%1.32B USD0.60%$183+0.11%iShares Russell 2000 ETFIWMVanguard Morningstar Total Stock Market ETFVTIVanguard Information Technology ETFVGTInspire Fidelis Multi Factor ETFFDLSVanguard Extended Market ETFVXFiShares Russell 2000 Growth ETFIWOVanguard Russell 2000 ETFVTWOiShares Micro-Cap ETFIWC
AI-generated and delayed market data for informational and educational purposes only. Not investment advice.





