Loading

NASDAQIndustrialsIndustrial - Distribution
Latest quote
$154.14
−$4.10 · -2.59%
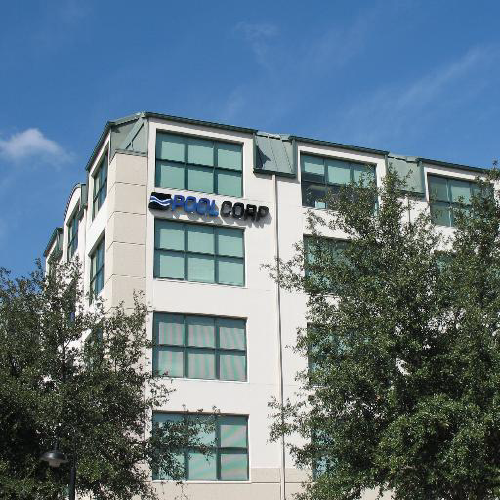
Pool Corporation, established in 1993 and based in Covington, Louisiana, serves as a leading wholesale distributor of swimming pool essentials, outdoor living accessories, and related recreational merchandise. Operating extensively across the United States and globally, the company supported its diverse clientele through 410 sales centers spanning North America, Europe, and Australia as of March 2022. Its comprehensive product portfolio encompasses a broad array of upkeep items like chemicals, general provisions, and pool accouterments; components for servicing and replacing critical pool machinery such as purification systems, heating units, circulation pumps, and lighting fixtures; and structural elements including complete fiberglass pools, luxury spas, and comprehensive pre-packaged pool kits designed for both subterranean and elevated installations, encompassing structural walls, liners, support braces, and coping. Furthermore, Pool Corp. supplies diverse pool apparatus and constituent parts vital for both fresh installations and the refurbishment of existing aquatic facilities; irrigation solutions, including integrated system elements and specialized equipment and provisions for professional lawn maintenance; and construction essentials such as concrete, plumbing and electrical infrastructure, a variety of functional and aesthetic pool finishes, decking options, tiles, hardscaping elements, and natural stone for new builds and renovations. The company also offers specialized commercial-grade products, including robust heating units, essential safety apparatus, and industrial-scale pumps and filtration systems, alongside additional recreational and outdoor living items like barbecues and modules for custom outdoor kitchen setups. Pool Corporation's extensive client base includes swimming pool construction and renovation specialists, independent retailers of pool provisions, repair and maintenance enterprises, irrigation and landscape professionals, and institutional clients such as hospitality venues, educational institutions, and public recreational centers.
Previous close
$154.14
−$4.10 · -2.59%
Pre-market
$154.19
+$0.05 · +0.03%
Oct 8, 4:00 AM ET
Regular session · ET · Market data may be delayed.
Pool Corporation, established in 1993 and based in Covington, Louisiana, serves as a leading wholesale distributor of swimming pool essentials, outdoor living accessories, and related recreational merchandise. Operating extensively across the United States and globally, the company supported its diverse clientele through 410 sales centers spanning North America, Europe, and Australia as of March 2022. Its comprehensive product portfolio encompasses a broad array of upkeep items like chemicals, general provisions, and pool accouterments; components for servicing and replacing critical pool machinery such as purification systems, heating units, circulation pumps, and lighting fixtures; and structural elements including complete fiberglass pools, luxury spas, and comprehensive pre-packaged pool kits designed for both subterranean and elevated installations, encompassing structural walls, liners, support braces, and coping. Furthermore, Pool Corp. supplies diverse pool apparatus and constituent parts vital for both fresh installations and the refurbishment of existing aquatic facilities; irrigation solutions, including integrated system elements and specialized equipment and provisions for professional lawn maintenance; and construction essentials such as concrete, plumbing and electrical infrastructure, a variety of functional and aesthetic pool finishes, decking options, tiles, hardscaping elements, and natural stone for new builds and renovations. The company also offers specialized commercial-grade products, including robust heating units, essential safety apparatus, and industrial-scale pumps and filtration systems, alongside additional recreational and outdoor living items like barbecues and modules for custom outdoor kitchen setups. Pool Corporation's extensive client base includes swimming pool construction and renovation specialists, independent retailers of pool provisions, repair and maintenance enterprises, irrigation and landscape professionals, and institutional clients such as hospitality venues, educational institutions, and public recreational centers.
Day range
Current $154.14
52-week range
Current $154.14
Regular session · ET · Market data may be delayed.
GoAI Score
Hold
Valuation
82
Deep Value
Sentiment
70
Bullish
Risk
46
Elevated Risk
Momentum
37
Weakening
Full GoAI research
Thesis, catalysts, evidence, and risk analysis.
Pool Corporation, established in 1993 and based in Covington, Louisiana, serves as a leading wholesale distributor of swimming pool essentials, outdoor living accessories, and related recreational merchandise. Operating extensively across the United States and globally, the company supported its diverse clientele through 410 sales centers spanning North America, Europe, and Australia as of March 2022. Its comprehensive product portfolio encompasses a broad array of upkeep items like chemicals, general provisions, and pool accouterments; components for servicing and replacing critical pool machinery such as purification systems, heating units, circulation pumps, and lighting fixtures; and structural elements including complete fiberglass pools, luxury spas, and comprehensive pre-packaged pool kits designed for both subterranean and elevated installations, encompassing structural walls, liners, support braces, and coping. Furthermore, Pool Corp. supplies diverse pool apparatus and constituent parts vital for both fresh installations and the refurbishment of existing aquatic facilities; irrigation solutions, including integrated system elements and specialized equipment and provisions for professional lawn maintenance; and construction essentials such as concrete, plumbing and electrical infrastructure, a variety of functional and aesthetic pool finishes, decking options, tiles, hardscaping elements, and natural stone for new builds and renovations. The company also offers specialized commercial-grade products, including robust heating units, essential safety apparatus, and industrial-scale pumps and filtration systems, alongside additional recreational and outdoor living items like barbecues and modules for custom outdoor kitchen setups. Pool Corporation's extensive client base includes swimming pool construction and renovation specialists, independent retailers of pool provisions, repair and maintenance enterprises, irrigation and landscape professionals, and institutional clients such as hospitality venues, educational institutions, and public recreational centers.
Day range
Current $154.14
52-week range
Current $154.14
Third-party consensus; not a GoAI recommendation.
Average target
$211.57
37.26% upsidePrice history unavailable
High $260Average $211.57Low $185Cash distributions grouped by calendar year; partial years are marked.
$4.95
2025 complete year+66.1% since 2021
2026 partial: $3.85
$2.98
2,021
$3.80
2,022
$4.30
2,023
$4.70
2,024
$4.95
2,025
$3.85
2,026*
* Partial calendar year in the available dividend history.
| Action | Ex-dividend date | Details | Record date | Payment date |
|---|---|---|---|---|
Dividend | Aug 13, 2026 | $1.30Quarterly | Aug 13, 2026 | Aug 27, 2026 |
Dividend | May 14, 2026 | $1.30Quarterly | May 14, 2026 | May 28, 2026 |
Dividend | Mar 12, 2026 | $1.25Quarterly | Mar 12, 2026 | Mar 26, 2026 |
Dividend | Nov 12, 2025 | $1.25Quarterly | Nov 12, 2025 | Nov 26, 2025 |
Dividend | Aug 14, 2025 | $1.25Quarterly | Aug 14, 2025 | Aug 28, 2025 |
Dividend | May 15, 2025 | $1.25Quarterly | May 15, 2025 | May 29, 2025 |
Ex-dividend Aug 13, 2026
$1.30
Quarterly
Record Aug 13, 2026 · Payment Aug 27, 2026
Ex-dividend May 14, 2026
$1.30
Quarterly
Record May 14, 2026 · Payment May 28, 2026
Ex-dividend Mar 12, 2026
$1.25
Quarterly
Record Mar 12, 2026 · Payment Mar 26, 2026
Ex-dividend Nov 12, 2025
$1.25
Quarterly
Record Nov 12, 2025 · Payment Nov 26, 2025
Ex-dividend Aug 14, 2025
$1.25
Quarterly
Record Aug 14, 2025 · Payment Aug 28, 2025
Ex-dividend May 15, 2025
$1.25
Quarterly
Record May 15, 2025 · Payment May 29, 2025
Funds reporting this stock among their holdings, ordered by reported position size.
 Vanguard Morningstar Total Stock Market ETFVTI205.64M0.01%2.3T USD0.03%$381.03-0.40%
 Vanguard Morningstar Small-Cap ETFVB148.62M0.08%185.3B USD0.03%$286.98-1.41%
 Vanguard Morningstar Small-Cap Value ETFVBR94.36M0.14%68.2B USD0.05%$232.17-1.32%
 Vanguard Extended Market ETFVXF69.52M0.07%95.4B USD0.05%$233.49-1.56%
 State Street SPDR Portfolio S&P 600 Small Cap ETFSPSM53.01M0.33%16.01B USD0.03%$53.28-1.32%
 Dimensional - US Small Cap ETFDFAS38.74M0.11%34.14B USD0.31%$77.92-1.38%
 Vanguard Dividend Appreciation ETFVIG33.86M0.03%132.4B USD0.04%$236.99-0.32%
 State Street SPDR S&P 600 Small Cap Value ETFSLYV30.14M0.63%4.77B USD0.15%$102.88-1.20%Vanguard Morningstar Total Stock Market ETFVTIVanguard Morningstar Small-Cap ETFVBVanguard Morningstar Small-Cap Value ETFVBRVanguard Extended Market ETFVXFState Street SPDR Portfolio S&P 600 Small Cap ETFSPSMDimensional - US Small Cap ETFDFASVanguard Dividend Appreciation ETFVIGState Street SPDR S&P 600 Small Cap Value ETFSLYV
AI-generated and delayed market data for informational and educational purposes only. Not investment advice.