Loading
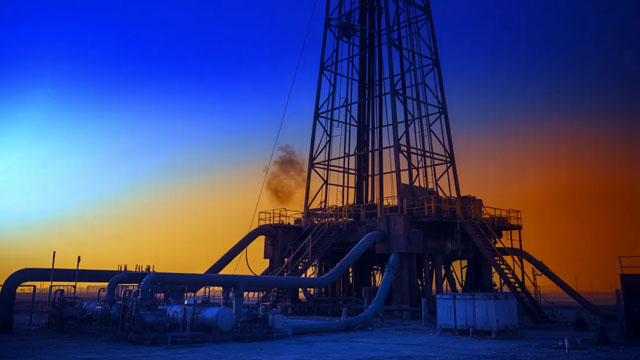
Shell plc, a distinguished energy and petrochemical corporation, is headquartered in London, United Kingdom, and was originally founded in 1907. Known as Royal Dutch Shell plc until its name change in January 2022, the company maintains a formidable global presence, conducting operations across Europe, Asia, Oceania, Africa, and both North and South America. Its comprehensive business activities are categorized into several key divisions: Integrated Gas, Upstream, Marketing, Chemicals and Products, and Renewables and Energy Solutions. Shell's core operations involve the exploration for and extraction of crude oil, natural gas, and natural gas liquids. Beyond production, the company is deeply involved in the marketing, transportation, and strategic infrastructure development required to deliver these energy resources to consumers. This includes the manufacturing of gas-to-liquids fuels and a variety of other refined products. Shell also operates a substantial trading arm, dealing in commodities such as natural gas, liquefied natural gas (LNG), crude oil, electricity, and carbon emission rights. Its refining capabilities convert crude oil and various feedstocks into a wide range of essential products, including gasoline, diesel, aviation and marine fuels, lubricants, bitumen, and sulfur, while also developing low-carbon fuel alternatives. In the chemical sector, Shell is a significant producer of petrochemicals for industrial use, manufacturing base chemicals like ethylene, propylene, and aromatics, alongside intermediate chemicals such as styrene monomer, propylene oxide, and various solvents. The company also manages oil sands assets. Looking to the future of energy, Shell is actively investing in and developing renewable solutions. This includes generating electricity from wind and solar power, pioneering hydrogen production and sales, and establishing a network of electric vehicle charging services. Furthermore, Shell promotes LNG as a viable fuel source for heavy-duty transportation.
Previous close
$100.18
−$0.02 · -0.02%
Regular session · ET · Market data may be delayed.
Shell plc, a distinguished energy and petrochemical corporation, is headquartered in London, United Kingdom, and was originally founded in 1907. Known as Royal Dutch Shell plc until its name change in January 2022, the company maintains a formidable global presence, conducting operations across Europe, Asia, Oceania, Africa, and both North and South America. Its comprehensive business activities are categorized into several key divisions: Integrated Gas, Upstream, Marketing, Chemicals and Products, and Renewables and Energy Solutions. Shell's core operations involve the exploration for and extraction of crude oil, natural gas, and natural gas liquids. Beyond production, the company is deeply involved in the marketing, transportation, and strategic infrastructure development required to deliver these energy resources to consumers. This includes the manufacturing of gas-to-liquids fuels and a variety of other refined products. Shell also operates a substantial trading arm, dealing in commodities such as natural gas, liquefied natural gas (LNG), crude oil, electricity, and carbon emission rights. Its refining capabilities convert crude oil and various feedstocks into a wide range of essential products, including gasoline, diesel, aviation and marine fuels, lubricants, bitumen, and sulfur, while also developing low-carbon fuel alternatives. In the chemical sector, Shell is a significant producer of petrochemicals for industrial use, manufacturing base chemicals like ethylene, propylene, and aromatics, alongside intermediate chemicals such as styrene monomer, propylene oxide, and various solvents. The company also manages oil sands assets. Looking to the future of energy, Shell is actively investing in and developing renewable solutions. This includes generating electricity from wind and solar power, pioneering hydrogen production and sales, and establishing a network of electric vehicle charging services. Furthermore, Shell promotes LNG as a viable fuel source for heavy-duty transportation.
Day range
Current $100.18
52-week range
Current $100.18
Regular session · ET · Market data may be delayed.
GoAI Score
Buy
Valuation
93
Deep Value
Sentiment
66
Bullish
Risk
19
Low Risk
Momentum
42
Neutral
Full GoAI research
Thesis, catalysts, evidence, and risk analysis.
Shell plc, a distinguished energy and petrochemical corporation, is headquartered in London, United Kingdom, and was originally founded in 1907. Known as Royal Dutch Shell plc until its name change in January 2022, the company maintains a formidable global presence, conducting operations across Europe, Asia, Oceania, Africa, and both North and South America. Its comprehensive business activities are categorized into several key divisions: Integrated Gas, Upstream, Marketing, Chemicals and Products, and Renewables and Energy Solutions. Shell's core operations involve the exploration for and extraction of crude oil, natural gas, and natural gas liquids. Beyond production, the company is deeply involved in the marketing, transportation, and strategic infrastructure development required to deliver these energy resources to consumers. This includes the manufacturing of gas-to-liquids fuels and a variety of other refined products. Shell also operates a substantial trading arm, dealing in commodities such as natural gas, liquefied natural gas (LNG), crude oil, electricity, and carbon emission rights. Its refining capabilities convert crude oil and various feedstocks into a wide range of essential products, including gasoline, diesel, aviation and marine fuels, lubricants, bitumen, and sulfur, while also developing low-carbon fuel alternatives. In the chemical sector, Shell is a significant producer of petrochemicals for industrial use, manufacturing base chemicals like ethylene, propylene, and aromatics, alongside intermediate chemicals such as styrene monomer, propylene oxide, and various solvents. The company also manages oil sands assets. Looking to the future of energy, Shell is actively investing in and developing renewable solutions. This includes generating electricity from wind and solar power, pioneering hydrogen production and sales, and establishing a network of electric vehicle charging services. Furthermore, Shell promotes LNG as a viable fuel source for heavy-duty transportation.
Day range
Current $100.18
52-week range
Current $100.18
Profitability as a percentage of reported revenue.
Revenue
Operating income
Net income
| Metric (USD) | FY2025 | FY2024 | FY2023 | FY2022 | FY2021 |
|---|---|---|---|---|---|
| Revenue | 266.89B USD | 284.31B USD | 316.62B USD | 381.31B USD | 261.5B USD |
| Cost of goods sold | 224.39B USD | 238.37B USD | 269.41B USD | 302.54B USD | 225.66B USD |
| Gross profit | 42.5B USD | 45.94B USD | 47.21B USD | 78.78B USD | 35.85B USD |
| Research and development | 1.17B USD | 1.1B USD | 1.29B USD | 1.08B USD | 815M USD |
| Selling, general, and administrative | 12.61B USD | 12.44B USD | 13.43B USD | 12.88B USD | 11.33B USD |
| Operating expenses | 14.91B USD | 15.95B USD | 16.47B USD | 15.67B USD | 13.57B USD |
| Interest income | 1.96B USD | 2.37B USD | 2.57B USD | 1.05B USD | 539M USD |
| Interest expense | 4.74B USD | 4.86B USD | 4.63B USD | 5.35B USD | 3.61B USD |
| Depreciation and amortization | 22.17B USD | 22.7B USD | 23.11B USD | 22.39B USD | 23.07B USD |
| Operating income | 27.58B USD | 29.99B USD | 30.74B USD | 63.11B USD | 22.28B USD |
| Net income | 17.84B USD | 16.09B USD | 19.36B USD | 42.31B USD | 20.1B USD |
Company facts updated Oct 10, 2026.
Recent quarterly results
Recent quarterly results
Third-party consensus; not a GoAI recommendation.
Average target
$102.53
2.35% upsideCash distributions grouped by calendar year; partial years are marked.
$2.864
2025 complete year+74.6% since 2021
2026 partial: $2.3064
$1.64
2,021
$1.98
2,022
$2.474
2,023
$2.752
2,024
$2.864
2,025
$2.3064
2,026*
* Partial calendar year in the available dividend history.
| Action | Ex-dividend date | Details | Record date | Payment date |
|---|---|---|---|---|
Dividend | Aug 14, 2026 | $0.7812Quarterly | Aug 14, 2026 | Sep 21, 2026 |
Dividend | May 22, 2026 | $0.7812Quarterly | May 22, 2026 | Jun 29, 2026 |
Dividend | Feb 20, 2026 | $0.744Quarterly | Feb 20, 2026 | Mar 30, 2026 |
Dividend | Nov 14, 2025 | $0.716Quarterly | Nov 14, 2025 | Dec 18, 2025 |
Dividend | Aug 15, 2025 | $0.716Quarterly | Aug 15, 2025 | Sep 22, 2025 |
Dividend | May 16, 2025 | $0.716Quarterly | May 16, 2025 | Jun 23, 2025 |
Ex-dividend Aug 14, 2026
$0.7812
Quarterly
Record Aug 14, 2026 · Payment Sep 21, 2026
Ex-dividend May 22, 2026
$0.7812
Quarterly
Record May 22, 2026 · Payment Jun 29, 2026
Ex-dividend Feb 20, 2026
$0.744
Quarterly
Record Feb 20, 2026 · Payment Mar 30, 2026
Ex-dividend Nov 14, 2025
$0.716
Quarterly
Record Nov 14, 2025 · Payment Dec 18, 2025
Ex-dividend Aug 15, 2025
$0.716
Quarterly
Record Aug 15, 2025 · Payment Sep 22, 2025
Ex-dividend May 16, 2025
$0.716
Quarterly
Record May 16, 2025 · Payment Jun 23, 2025
Funds reporting this stock among their holdings, ordered by reported position size.
 Dimensional - International Value ETFDFIV774.71M3.65%21.39B USD0.27%$55.42+0.25%
 State Street SPDR Portfolio Developed World ex-US ETFSPDW356.68M0.88%40.46B USD0.03%$49.98+0.64%
 State Street SPDR S&P Global Natural Resources ETFGNR267.4M5.21%5.13B USD0.40%$75.57+0.65%
 Avantis International Equity ETFAVDE181.45M0.95%19.22B USD0.23%$89.80+0.58%
 Dimensional - International Core Equity 2 ETFDFIC163.8M1.10%15.02B USD0.22%$37.53+0.64%
 Fidelity Enhanced International ETFFENI66.47M0.58%11.47B USD0.28%$39.69+0.43%
 Dimensional World ex U.S. Core Equity 2 ETFDFAX62.42M0.51%12.34B USD0.28%$37.08+0.76%
 Avantis International Large Cap Value ETFAVIV44.65M2.21%2.02B USD0.25%$79.00+0.34%Dimensional - International Value ETFDFIVState Street SPDR Portfolio Developed World ex-US ETFSPDWState Street SPDR S&P Global Natural Resources ETFGNRAvantis International Equity ETFAVDEDimensional - International Core Equity 2 ETFDFICFidelity Enhanced International ETFFENIDimensional World ex U.S. Core Equity 2 ETFDFAXAvantis International Large Cap Value ETFAVIV
AI-generated and delayed market data for informational and educational purposes only. Not investment advice.