Loading
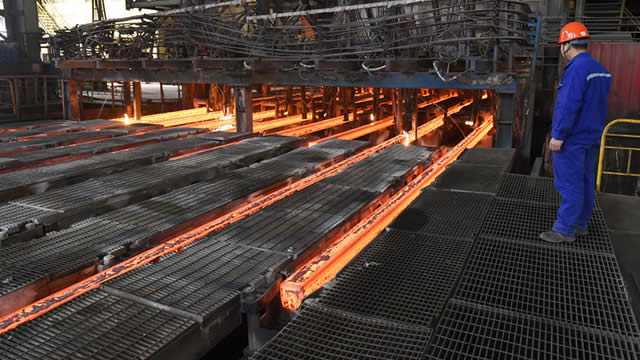
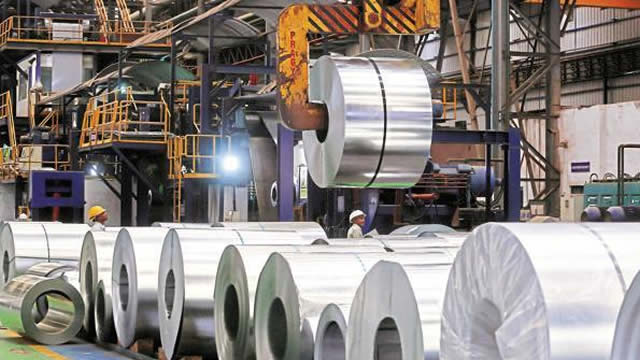
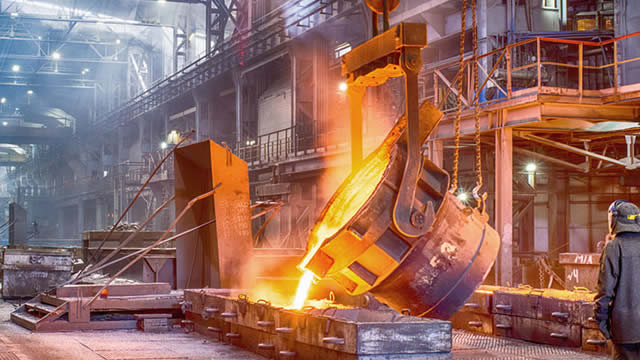
Steel Dynamics, Inc. is a prominent American steel manufacturer and metal recycling enterprise, conducting its operations through three distinct business divisions. The Steel Operations segment is responsible for producing a broad range of steel products, including hot, cold, and coated rolled steel, various structural shapes like beams, channels, and angles, flat and reinforcing bars, and a diverse selection of rail and engineered steel bar products. This segment also provides specialized processing services for both bar products (such as turning, polishing, and heat treating) and specialty items (including cutting, welding, and galvanizing). Its offerings cater to numerous industries, such as construction, automotive, manufacturing, transportation, heavy and agricultural equipment, and pipe and tube production. Sales are channeled directly to end-users, steel fabricators, and service centers. The Metals Recycling Operations division focuses on acquiring, processing, and reselling ferrous (e.g., heavy melting steel, shredded scrap, cast iron) and nonferrous (e.g., aluminum, copper, stainless steel) scrap metals, transforming them into reusable materials. This division further offers supplementary services including transportation logistics, marketing, brokerage, and scrap management. The Steel Fabrication Operations segment manufactures crucial components for commercial building construction, such as steel joists, girders, trusses, and steel deck products. Established in 1993 and headquartered in Fort Wayne, Indiana, the company also engages in exporting its products internationally.
Previous close
$238.38
+$4.21 · +1.80%
After-hours
$238.38
$0.00 · 0.00%
Oct 9, 7:30 PM ET
Regular session · ET · Market data may be delayed.
Steel Dynamics, Inc. is a prominent American steel manufacturer and metal recycling enterprise, conducting its operations through three distinct business divisions. The Steel Operations segment is responsible for producing a broad range of steel products, including hot, cold, and coated rolled steel, various structural shapes like beams, channels, and angles, flat and reinforcing bars, and a diverse selection of rail and engineered steel bar products. This segment also provides specialized processing services for both bar products (such as turning, polishing, and heat treating) and specialty items (including cutting, welding, and galvanizing). Its offerings cater to numerous industries, such as construction, automotive, manufacturing, transportation, heavy and agricultural equipment, and pipe and tube production. Sales are channeled directly to end-users, steel fabricators, and service centers. The Metals Recycling Operations division focuses on acquiring, processing, and reselling ferrous (e.g., heavy melting steel, shredded scrap, cast iron) and nonferrous (e.g., aluminum, copper, stainless steel) scrap metals, transforming them into reusable materials. This division further offers supplementary services including transportation logistics, marketing, brokerage, and scrap management. The Steel Fabrication Operations segment manufactures crucial components for commercial building construction, such as steel joists, girders, trusses, and steel deck products. Established in 1993 and headquartered in Fort Wayne, Indiana, the company also engages in exporting its products internationally.
Day range
Current $238.38
52-week range
Current $238.38
Regular session · ET · Market data may be delayed.
GoAI Score
Hold
Valuation
67
Undervalued
Sentiment
62
Bullish
Risk
46
Elevated Risk
Momentum
49
Neutral
Full GoAI research
Thesis, catalysts, evidence, and risk analysis.
Steel Dynamics, Inc. is a prominent American steel manufacturer and metal recycling enterprise, conducting its operations through three distinct business divisions. The Steel Operations segment is responsible for producing a broad range of steel products, including hot, cold, and coated rolled steel, various structural shapes like beams, channels, and angles, flat and reinforcing bars, and a diverse selection of rail and engineered steel bar products. This segment also provides specialized processing services for both bar products (such as turning, polishing, and heat treating) and specialty items (including cutting, welding, and galvanizing). Its offerings cater to numerous industries, such as construction, automotive, manufacturing, transportation, heavy and agricultural equipment, and pipe and tube production. Sales are channeled directly to end-users, steel fabricators, and service centers. The Metals Recycling Operations division focuses on acquiring, processing, and reselling ferrous (e.g., heavy melting steel, shredded scrap, cast iron) and nonferrous (e.g., aluminum, copper, stainless steel) scrap metals, transforming them into reusable materials. This division further offers supplementary services including transportation logistics, marketing, brokerage, and scrap management. The Steel Fabrication Operations segment manufactures crucial components for commercial building construction, such as steel joists, girders, trusses, and steel deck products. Established in 1993 and headquartered in Fort Wayne, Indiana, the company also engages in exporting its products internationally.
Day range
Current $238.38
52-week range
Current $238.38
Profitability as a percentage of reported revenue.
Revenue
Operating income
Net income
| Metric (USD) | FY2025 | FY2024 | FY2023 | FY2022 | FY2021 |
|---|---|---|---|---|---|
| Revenue | 18.18B USD | 17.54B USD | 18.8B USD | 22.26B USD | 18.41B USD |
| Cost of goods sold | 15.81B USD | 14.74B USD | 14.75B USD | 16.14B USD | 13.05B USD |
| Gross profit | 2.36B USD | 2.8B USD | 4.05B USD | 6.12B USD | 5.36B USD |
| Selling, general, and administrative | 888.29M USD | 664.12M USD | 588.62M USD | 545.62M USD | 643.98M USD |
| Operating expenses | 888.29M USD | 859.55M USD | 894.7M USD | 1.03B USD | 1.06B USD |
| Interest expense | 70.04M USD | 56.35M USD | 76.48M USD | 91.54M USD | 57.21M USD |
| Depreciation and amortization | 551.39M USD | 478.91M USD | 437.8M USD | 384.2M USD | 347.65M USD |
| Operating income | 1.48B USD | 1.94B USD | 3.15B USD | 5.09B USD | 4.3B USD |
| Net income | 1.19B USD | 1.54B USD | 2.45B USD | 3.86B USD | 3.21B USD |
Company facts updated Oct 10, 2026.
Recent quarterly results
Recent quarterly results
Third-party consensus; not a GoAI recommendation.
Cash distributions grouped by calendar year; partial years are marked.
$2.00
2025 complete year+92.3% since 2021
2026 partial: $1.59
$1.04
2,021
$1.36
2,022
$1.70
2,023
$1.84
2,024
$2.00
2,025
$1.59
2,026*
* Partial calendar year in the available dividend history.
| Action | Ex-dividend date | Details | Record date | Payment date |
|---|---|---|---|---|
Dividend | Sep 30, 2026 | $0.53Quarterly | Sep 30, 2026 | Oct 9, 2026 |
Dividend | Jun 30, 2026 | $0.53Quarterly | Jun 30, 2026 | Jul 10, 2026 |
Dividend | Mar 31, 2026 | $0.53Quarterly | Mar 31, 2026 | Apr 10, 2026 |
Dividend | Dec 31, 2025 | $0.50Quarterly | Dec 31, 2025 | Jan 9, 2026 |
Dividend | Sep 30, 2025 | $0.50Quarterly | Sep 30, 2025 | Oct 10, 2025 |
Dividend | Jun 30, 2025 | $0.50Quarterly | Jun 30, 2025 | Jul 11, 2025 |
Ex-dividend Sep 30, 2026
$0.53
Quarterly
Record Sep 30, 2026 · Payment Oct 9, 2026
Ex-dividend Jun 30, 2026
$0.53
Quarterly
Record Jun 30, 2026 · Payment Jul 10, 2026
Ex-dividend Mar 31, 2026
$0.53
Quarterly
Record Mar 31, 2026 · Payment Apr 10, 2026
Ex-dividend Dec 31, 2025
$0.50
Quarterly
Record Dec 31, 2025 · Payment Jan 9, 2026
Ex-dividend Sep 30, 2025
$0.50
Quarterly
Record Sep 30, 2025 · Payment Oct 10, 2025
Ex-dividend Jun 30, 2025
$0.50
Quarterly
Record Jun 30, 2025 · Payment Jul 11, 2025
Funds reporting this stock among their holdings, ordered by reported position size.
 State Street SPDR S&P 500 ETF1557.T61.27B0.05%129.34T JPY0.09%¥122,850+0.12%
 Vanguard Morningstar Total Stock Market ETFVTI1.01B0.04%2.3T USD0.03%$381.94+0.63%
 Vanguard S&P 500 ETFVOO837.59M0.05%1.8T USD0.03%$715.59+0.61%
 iShares Core S&P 500 ETFIVV419.38M0.05%892.79B USD0.03%$781.97+0.60%
 State Street SPDR S&P 500 ETFSPY387.18M0.05%817.2B USD0.09%$778.57+0.60%
 State Street Materials Select Sector SPDR ETFXLB368.38M4.76%7.79B USD0.08%$49.43+0.32%
 Vanguard Morningstar Small-Cap ETFVB366.62M0.20%185.3B USD0.03%$289.48+0.64%
 Vanguard Morningstar Mid-Cap ETFVO344.68M0.15%226.4B USD0.03%$81.14+0.92%State Street SPDR S&P 500 ETF1557.TVanguard Morningstar Total Stock Market ETFVTIVanguard S&P 500 ETFVOOiShares Core S&P 500 ETFIVVState Street SPDR S&P 500 ETFSPYState Street Materials Select Sector SPDR ETFXLBVanguard Morningstar Small-Cap ETFVBVanguard Morningstar Mid-Cap ETFVO
AI-generated and delayed market data for informational and educational purposes only. Not investment advice.