Loading

NYSEConsumer CyclicalAuto - Manufacturers
Latest quote
$185.3
−$0.70 · -0.38%
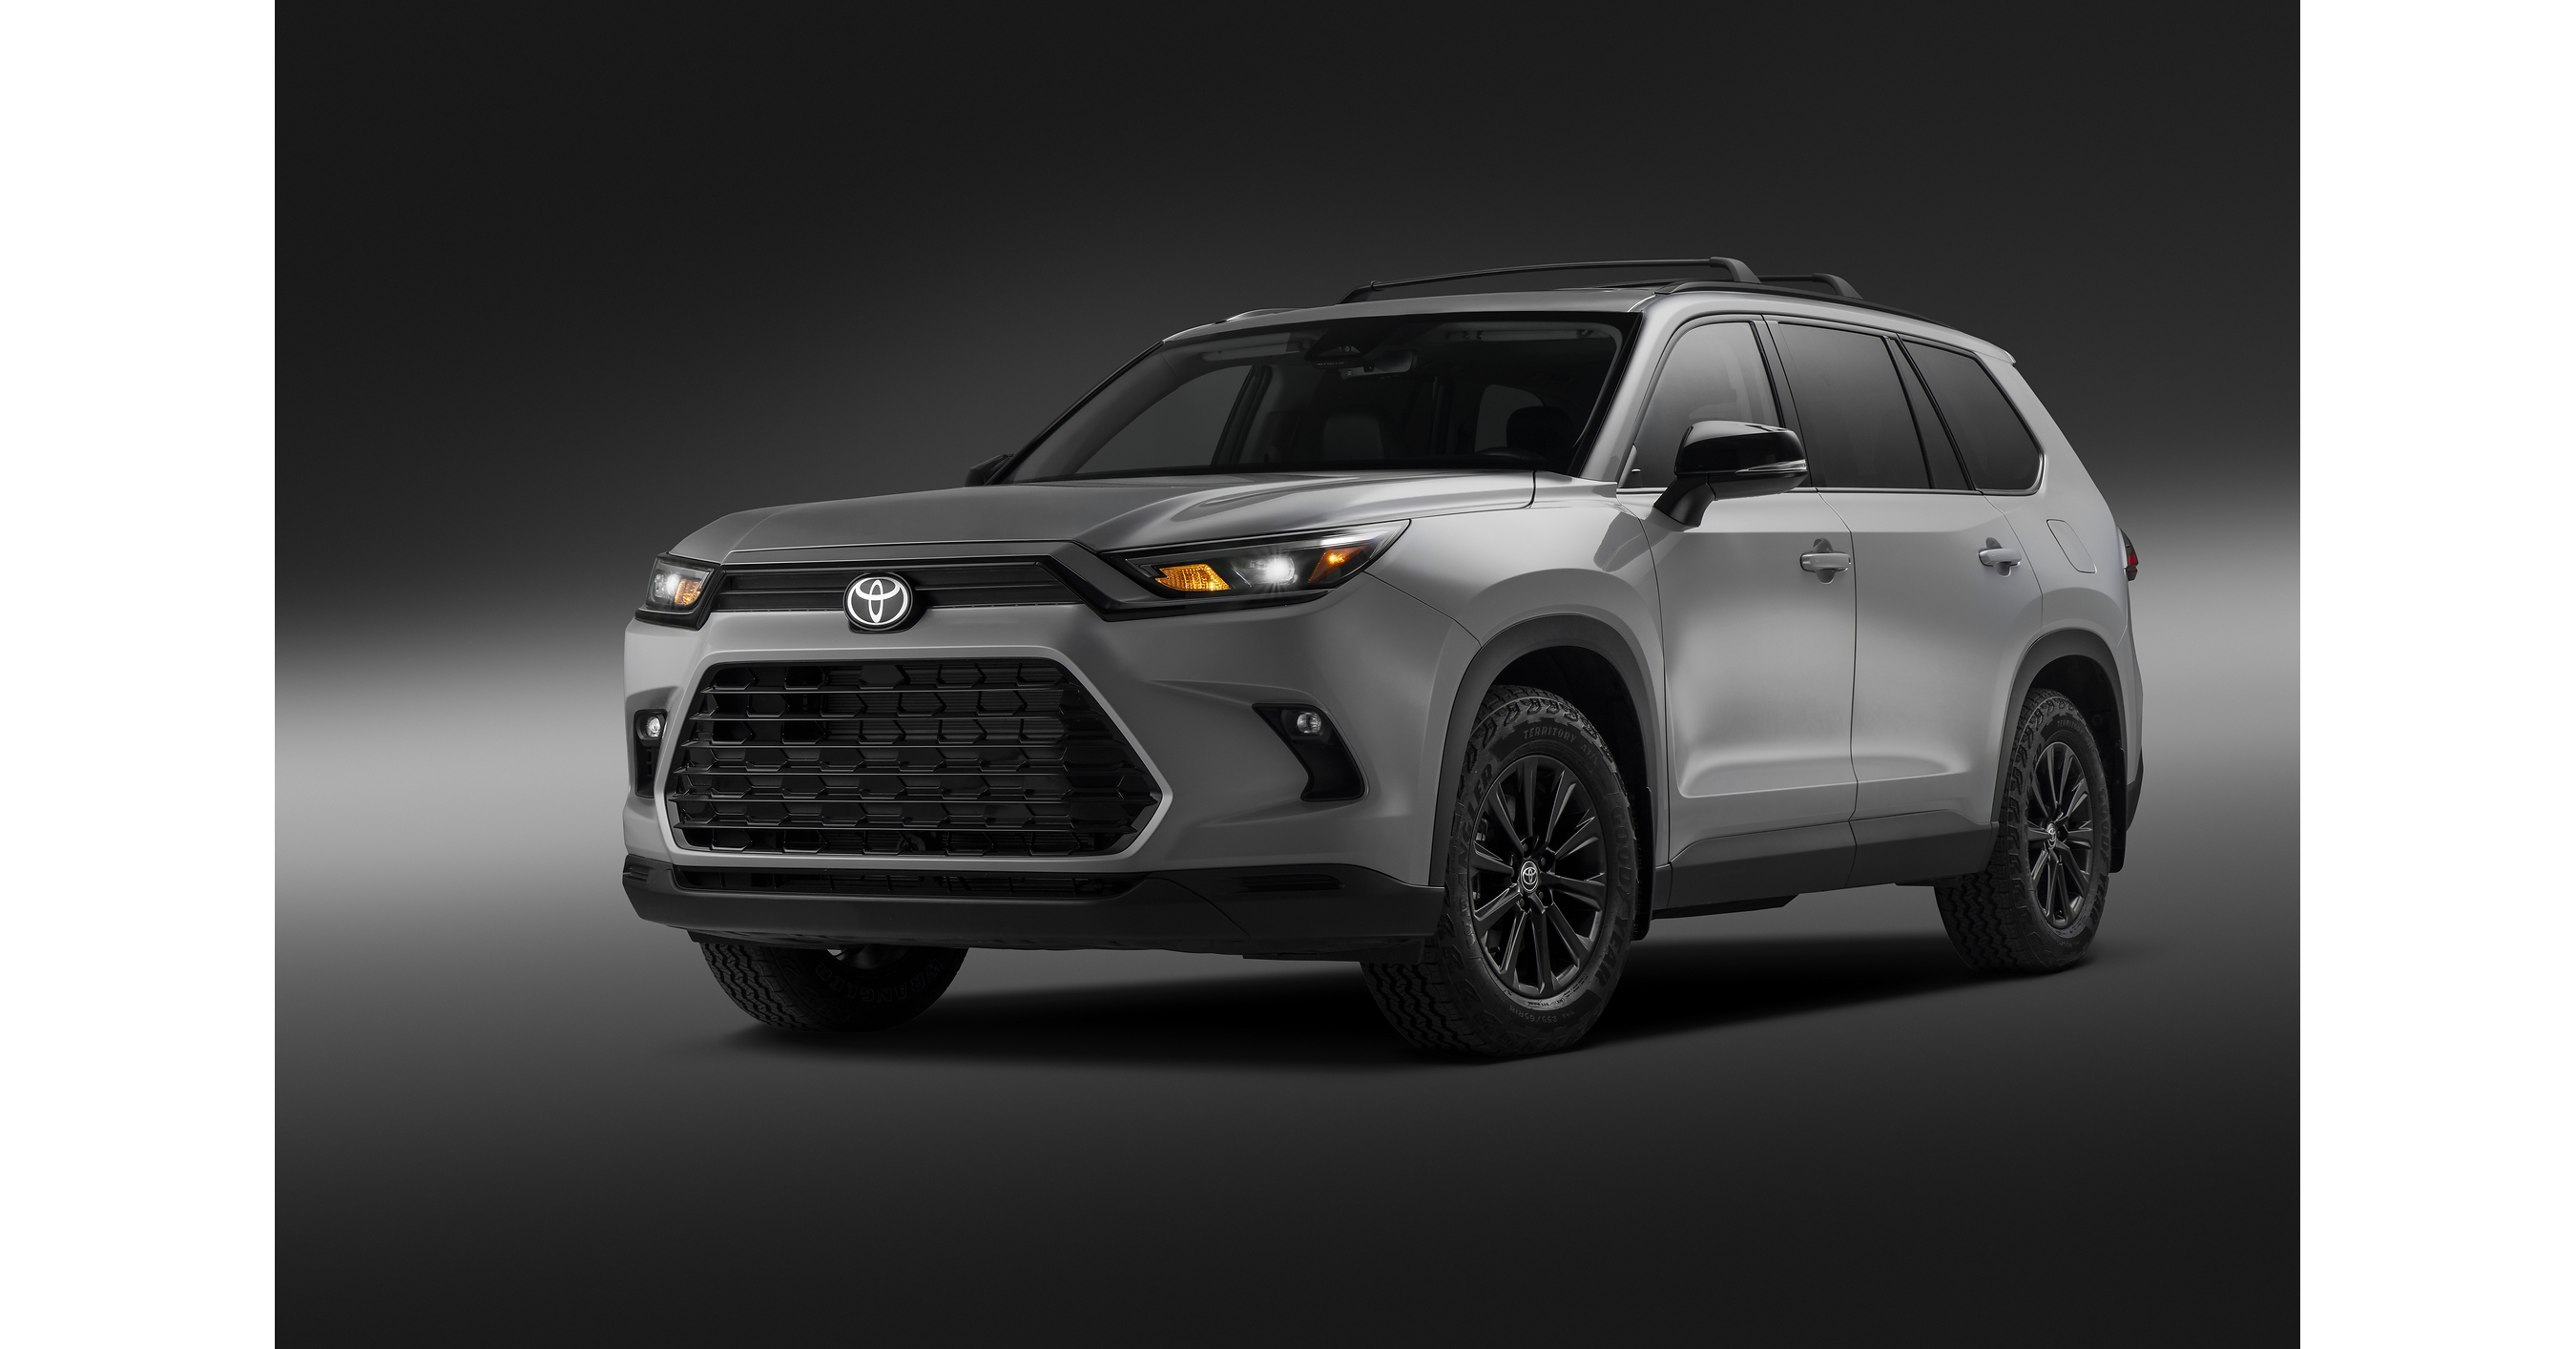
Toyota Motor Corporation is a multinational automotive manufacturer responsible for the design, production, assembly, and sale of a diverse range of passenger vehicles, minivans, commercial vehicles, and their associated components and accessories. The company organizes its operations into distinct segments: Automotive, Financial Services, and various other ventures. Its extensive vehicle portfolio includes environmentally friendly options such as hybrid cars under the Prius brand and advanced fuel cell vehicles like the MIRAI. For conventional engine vehicles, it offers models like the subcompact and compact Corolla and Raize. Under the overarching Toyota brand, the company provides mini-vehicles, general passenger cars, commercial vehicles, and automotive parts. Its offerings also encompass mid-size and luxury automobiles, alongside sports cars such as the GR Yaris, Corolla Sport, Corolla Cross, and Supra, and recreational and sport-utility vehicles like the Highlander. Furthermore, Toyota produces pickup trucks, exemplified by the Tacoma, as well as minivans, heavy-duty trucks, and buses. Beyond vehicle manufacturing, Toyota provides a suite of financial services, including retail and wholesale financing, leasing arrangements, insurance products, and credit cards. It also diversifies into the prefabricated housing sector, handling its design, manufacturing, and sales. For automotive enthusiasts, the company operates GAZOO.com, an informational web portal. Established in 1933 and headquartered in Toyota, Japan, the company boasts a global presence, conducting business across Japan, North America, Europe, Asia, Central and South America, Oceania, Africa, and the Middle East.
Previous close
$185.3
−$0.70 · -0.38%
Regular session · ET · Market data may be delayed.
Toyota Motor Corporation is a multinational automotive manufacturer responsible for the design, production, assembly, and sale of a diverse range of passenger vehicles, minivans, commercial vehicles, and their associated components and accessories. The company organizes its operations into distinct segments: Automotive, Financial Services, and various other ventures. Its extensive vehicle portfolio includes environmentally friendly options such as hybrid cars under the Prius brand and advanced fuel cell vehicles like the MIRAI. For conventional engine vehicles, it offers models like the subcompact and compact Corolla and Raize. Under the overarching Toyota brand, the company provides mini-vehicles, general passenger cars, commercial vehicles, and automotive parts. Its offerings also encompass mid-size and luxury automobiles, alongside sports cars such as the GR Yaris, Corolla Sport, Corolla Cross, and Supra, and recreational and sport-utility vehicles like the Highlander. Furthermore, Toyota produces pickup trucks, exemplified by the Tacoma, as well as minivans, heavy-duty trucks, and buses. Beyond vehicle manufacturing, Toyota provides a suite of financial services, including retail and wholesale financing, leasing arrangements, insurance products, and credit cards. It also diversifies into the prefabricated housing sector, handling its design, manufacturing, and sales. For automotive enthusiasts, the company operates GAZOO.com, an informational web portal. Established in 1933 and headquartered in Toyota, Japan, the company boasts a global presence, conducting business across Japan, North America, Europe, Asia, Central and South America, Oceania, Africa, and the Middle East.
Day range
Current $185.3
52-week range
Current $185.3
Regular session · ET · Market data may be delayed.
GoAI Score
Hold
Valuation
73
Undervalued
Sentiment
63
Bullish
Risk
30
Moderate Risk
Momentum
36
Weakening
Full GoAI research
Thesis, catalysts, evidence, and risk analysis.
Toyota Motor Corporation is a multinational automotive manufacturer responsible for the design, production, assembly, and sale of a diverse range of passenger vehicles, minivans, commercial vehicles, and their associated components and accessories. The company organizes its operations into distinct segments: Automotive, Financial Services, and various other ventures. Its extensive vehicle portfolio includes environmentally friendly options such as hybrid cars under the Prius brand and advanced fuel cell vehicles like the MIRAI. For conventional engine vehicles, it offers models like the subcompact and compact Corolla and Raize. Under the overarching Toyota brand, the company provides mini-vehicles, general passenger cars, commercial vehicles, and automotive parts. Its offerings also encompass mid-size and luxury automobiles, alongside sports cars such as the GR Yaris, Corolla Sport, Corolla Cross, and Supra, and recreational and sport-utility vehicles like the Highlander. Furthermore, Toyota produces pickup trucks, exemplified by the Tacoma, as well as minivans, heavy-duty trucks, and buses. Beyond vehicle manufacturing, Toyota provides a suite of financial services, including retail and wholesale financing, leasing arrangements, insurance products, and credit cards. It also diversifies into the prefabricated housing sector, handling its design, manufacturing, and sales. For automotive enthusiasts, the company operates GAZOO.com, an informational web portal. Established in 1933 and headquartered in Toyota, Japan, the company boasts a global presence, conducting business across Japan, North America, Europe, Asia, Central and South America, Oceania, Africa, and the Middle East.
Day range
Current $185.3
52-week range
Current $185.3
Profitability as a percentage of reported revenue.
Revenue
Operating income
Net income
| Metric (JPY) | FY2026 | FY2025 | FY2024 | FY2023 | FY2022 |
|---|---|---|---|---|---|
| Revenue | 50.68T JPY | 48.04T JPY | 45.1T JPY | 37.15T JPY | 31.38T JPY |
| Cost of goods sold | 42.22T JPY | 38.46T JPY | 35.73T JPY | 30.84T JPY | 25.41T JPY |
| Gross profit | 8.46T JPY | 9.58T JPY | 9.37T JPY | 6.31T JPY | 5.97T JPY |
| Selling, general, and administrative | 4.7T JPY | 4.78T JPY | 4.02T JPY | 3.59T JPY | 2.98T JPY |
| Operating expenses | 4.7T JPY | 4.78T JPY | 4.02T JPY | 3.59T JPY | 2.98T JPY |
| Interest income | 311.52B JPY | 364.63B JPY | 454.69B JPY | 234.1B JPY | 101.51B JPY |
| Interest expense | 60.29B JPY | 84.11B JPY | 64.73B JPY | 47.36B JPY | 32.46B JPY |
| Depreciation and amortization | 2.54T JPY | 2.25T JPY | 2.09T JPY | 2.04T JPY | 1.82T JPY |
| Operating income | 3.77T JPY | 4.8T JPY | 5.35T JPY | 2.73T JPY | 3T JPY |
| Net income | 3.99T JPY | 4.77T JPY | 4.94T JPY | 2.45T JPY | 2.85T JPY |
Company facts updated Oct 11, 2026.
Recent quarterly results
Recent quarterly results
Third-party consensus; not a GoAI recommendation.
Average target
$179.41
3.18% downsideCash distributions grouped by calendar year; partial years are marked.
$6.3242
2025 complete year+39.1% since 2021
2026 partial: $6.2861
$4.5478
2,021
$3.9648
2,022
$4.4984
2,023
$5.1503
2,024
$6.3242
2,025
$6.2861
2,026*
* Partial calendar year in the available dividend history.
| Action | Ex-dividend date | Details | Record date | Payment date |
|---|---|---|---|---|
Dividend | Sep 30, 2026 | $3.1529Semi-Annual | Sep 30, 2026 | — |
Dividend | Mar 31, 2026 | $3.1333Semi-Annual | Mar 31, 2026 | Jun 8, 2026 |
Dividend | Sep 30, 2025 | $2.8673Semi-Annual | Sep 30, 2025 | Dec 8, 2025 |
Dividend | Mar 31, 2025 | $3.4569Semi-Annual | Mar 31, 2025 | Jun 5, 2025 |
Dividend | Sep 30, 2024 | $2.6008Semi-Annual | Sep 30, 2024 | Dec 6, 2024 |
Dividend | Mar 27, 2024 | $2.5495Semi-Annual | Mar 28, 2024 | Jun 3, 2024 |
Ex-dividend Sep 30, 2026
$3.1529
Semi-Annual
Record Sep 30, 2026
Ex-dividend Mar 31, 2026
$3.1333
Semi-Annual
Record Mar 31, 2026 · Payment Jun 8, 2026
Ex-dividend Sep 30, 2025
$2.8673
Semi-Annual
Record Sep 30, 2025 · Payment Dec 8, 2025
Ex-dividend Mar 31, 2025
$3.4569
Semi-Annual
Record Mar 31, 2025 · Payment Jun 5, 2025
Ex-dividend Sep 30, 2024
$2.6008
Semi-Annual
Record Sep 30, 2024 · Payment Dec 6, 2024
Ex-dividend Mar 27, 2024
$2.5495
Semi-Annual
Record Mar 28, 2024 · Payment Jun 3, 2024
Funds reporting this stock among their holdings, ordered by reported position size.
 Avantis International Equity ETFAVDE83.97M0.44%19.22B USD0.23%$89.80+0.58%
 First Trust Value Line Dividend Index FundFVD30.97M0.41%7.62B USD0.62%$47.66+0.13%
 Avantis International Large Cap Value ETFAVIV19.58M0.97%2.02B USD0.25%$79.00+0.34%
 Invesco International Dividend Achievers ETFPID14.59M1.70%857.93M USD0.53%$21.7117+0.10%
 State Street SPDR S&P Emerging Markets Dividend ETFEDIV11.29M0.97%1.17B USD0.49%$40.04+0.65%
 GMO International Value ETFGMOI8.76M1.30%654M USD0.60%$39.18+0.26%
 ActivePassive International Equity ETFAPIE6.98M0.61%1.14B USD0.45%$38.56+0.65%
 State Street SPDR S&P Kensho New Economies Composite ETFKOMP6.72M0.26%2.61B USD0.20%$66.35+1.13%Avantis International Equity ETFAVDEFirst Trust Value Line Dividend Index FundFVDAvantis International Large Cap Value ETFAVIVInvesco International Dividend Achievers ETFPIDState Street SPDR S&P Emerging Markets Dividend ETFEDIVGMO International Value ETFGMOIActivePassive International Equity ETFAPIEState Street SPDR S&P Kensho New Economies Composite ETFKOMP
AI-generated and delayed market data for informational and educational purposes only. Not investment advice.