Loading

NYSEIndustrialsWaste Management
Latest quote
$155.16
+$0.54 · +0.35%
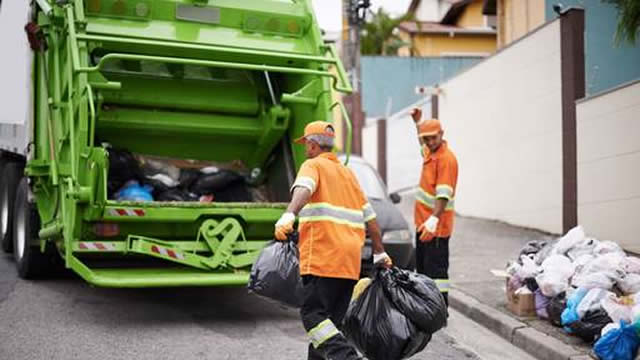
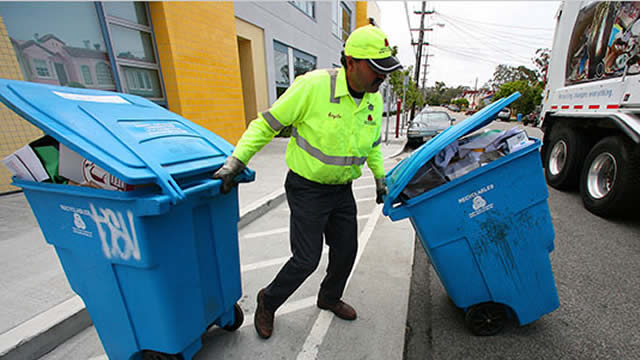
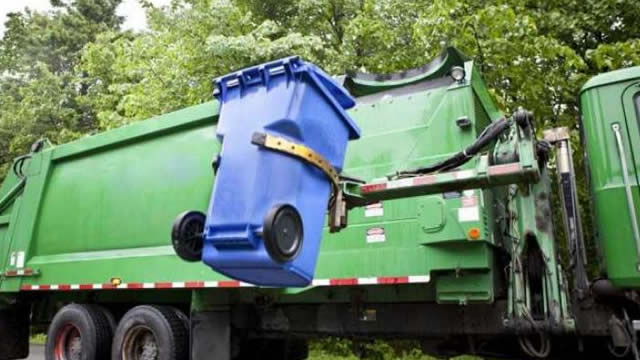
Waste Connections, Inc. is a leading environmental services provider that delivers a full spectrum of non-hazardous waste management solutions, including collection, transfer, disposal, and resource recovery, across both the United States and Canada. The company offers essential waste collection services to a diverse customer base, spanning residential, commercial, municipal, industrial, and exploration and production (E&P) sectors. Beyond collection, their operations encompass landfill management for final waste disposition and comprehensive recycling programs for a wide array of materials, such as compostables, cardboard, mixed paper, plastic containers, glass bottles, and both ferrous and aluminum metals. Waste Connections also maintains and operates a network of transfer stations, which efficiently receive, compact, and load waste for subsequent transport—by truck, rail, or barge—to either landfills or specialized treatment facilities. In the Pacific Northwest, the company further provides intermodal services through a dedicated network, facilitating the rail movement of general cargo and solid waste containers. A specialized component of their offerings includes the treatment, recovery, and safe disposal of waste generated by oil and natural gas exploration and production activities. This includes complex materials such as drilling fluids, drill cuttings, completion fluids, flowback water, ongoing production wastes, produced water from operational wells, contaminated soils requiring remediation during site reclamation, and substances needing clean-up after spills, reserve pit operations, or pipeline ruptures. Additionally, the company provides equipment leasing options to its customers. As of December 31, 2021, Waste Connections possessed a robust infrastructure, owning 334 solid waste collection operations, 142 transfer stations, 61 municipal solid waste (MSW) landfills, 12 E&P waste landfills, 14 non-MSW landfills, 71 recycling facilities, 4 intermodal operations, 23 E&P liquid waste injection wells, and 19 E&P waste treatment and oil recovery facilities. The company also manages an additional 53 transfer stations, 10 MSW landfills, and 2 intermodal operations. Waste Connections, Inc. was established in 1997 and its corporate headquarters are situated in Woodbridge, Canada.
Previous close
$155.16
+$0.54 · +0.35%
After-hours
$155.16
$0.00 · 0.00%
Oct 7, 5:32 PM ET
Regular session · ET · Market data may be delayed.
Waste Connections, Inc. is a leading environmental services provider that delivers a full spectrum of non-hazardous waste management solutions, including collection, transfer, disposal, and resource recovery, across both the United States and Canada. The company offers essential waste collection services to a diverse customer base, spanning residential, commercial, municipal, industrial, and exploration and production (E&P) sectors. Beyond collection, their operations encompass landfill management for final waste disposition and comprehensive recycling programs for a wide array of materials, such as compostables, cardboard, mixed paper, plastic containers, glass bottles, and both ferrous and aluminum metals. Waste Connections also maintains and operates a network of transfer stations, which efficiently receive, compact, and load waste for subsequent transport—by truck, rail, or barge—to either landfills or specialized treatment facilities. In the Pacific Northwest, the company further provides intermodal services through a dedicated network, facilitating the rail movement of general cargo and solid waste containers. A specialized component of their offerings includes the treatment, recovery, and safe disposal of waste generated by oil and natural gas exploration and production activities. This includes complex materials such as drilling fluids, drill cuttings, completion fluids, flowback water, ongoing production wastes, produced water from operational wells, contaminated soils requiring remediation during site reclamation, and substances needing clean-up after spills, reserve pit operations, or pipeline ruptures. Additionally, the company provides equipment leasing options to its customers. As of December 31, 2021, Waste Connections possessed a robust infrastructure, owning 334 solid waste collection operations, 142 transfer stations, 61 municipal solid waste (MSW) landfills, 12 E&P waste landfills, 14 non-MSW landfills, 71 recycling facilities, 4 intermodal operations, 23 E&P liquid waste injection wells, and 19 E&P waste treatment and oil recovery facilities. The company also manages an additional 53 transfer stations, 10 MSW landfills, and 2 intermodal operations. Waste Connections, Inc. was established in 1997 and its corporate headquarters are situated in Woodbridge, Canada.
Day range
Current $155.16
52-week range
Current $155.16
Regular session · ET · Market data may be delayed.
GoAI Score
Buy
Valuation
79
Undervalued
Sentiment
66
Bullish
Risk
21
Moderate Risk
Momentum
45
Neutral
Full GoAI research
Thesis, catalysts, evidence, and risk analysis.
Waste Connections, Inc. is a leading environmental services provider that delivers a full spectrum of non-hazardous waste management solutions, including collection, transfer, disposal, and resource recovery, across both the United States and Canada. The company offers essential waste collection services to a diverse customer base, spanning residential, commercial, municipal, industrial, and exploration and production (E&P) sectors. Beyond collection, their operations encompass landfill management for final waste disposition and comprehensive recycling programs for a wide array of materials, such as compostables, cardboard, mixed paper, plastic containers, glass bottles, and both ferrous and aluminum metals. Waste Connections also maintains and operates a network of transfer stations, which efficiently receive, compact, and load waste for subsequent transport—by truck, rail, or barge—to either landfills or specialized treatment facilities. In the Pacific Northwest, the company further provides intermodal services through a dedicated network, facilitating the rail movement of general cargo and solid waste containers. A specialized component of their offerings includes the treatment, recovery, and safe disposal of waste generated by oil and natural gas exploration and production activities. This includes complex materials such as drilling fluids, drill cuttings, completion fluids, flowback water, ongoing production wastes, produced water from operational wells, contaminated soils requiring remediation during site reclamation, and substances needing clean-up after spills, reserve pit operations, or pipeline ruptures. Additionally, the company provides equipment leasing options to its customers. As of December 31, 2021, Waste Connections possessed a robust infrastructure, owning 334 solid waste collection operations, 142 transfer stations, 61 municipal solid waste (MSW) landfills, 12 E&P waste landfills, 14 non-MSW landfills, 71 recycling facilities, 4 intermodal operations, 23 E&P liquid waste injection wells, and 19 E&P waste treatment and oil recovery facilities. The company also manages an additional 53 transfer stations, 10 MSW landfills, and 2 intermodal operations. Waste Connections, Inc. was established in 1997 and its corporate headquarters are situated in Woodbridge, Canada.
Day range
Current $155.16
52-week range
Current $155.16
Recent quarterly results
Recent quarterly results
Third-party consensus; not a GoAI recommendation.
Cash distributions grouped by calendar year; partial years are marked.
$1.295
2025 complete year+53.3% since 2021
2026 partial: $1.05
$0.845
2,021
$0.945
2,022
$1.05
2,023
$1.17
2,024
$1.295
2,025
$1.05
2,026*
* Partial calendar year in the available dividend history.
| Action | Ex-dividend date | Details | Record date | Payment date |
|---|---|---|---|---|
Dividend | Aug 6, 2026 | $0.35Quarterly | Aug 6, 2026 | Aug 20, 2026 |
Dividend | May 6, 2026 | $0.35Quarterly | May 6, 2026 | May 21, 2026 |
Dividend | Feb 25, 2026 | $0.35Quarterly | Feb 25, 2026 | Mar 12, 2026 |
Dividend | Nov 5, 2025 | $0.35Quarterly | Nov 5, 2025 | Nov 20, 2025 |
Dividend | Aug 6, 2025 | $0.315Quarterly | Aug 6, 2025 | Aug 21, 2025 |
Dividend | May 7, 2025 | $0.315Quarterly | May 7, 2025 | May 22, 2025 |
Ex-dividend Aug 6, 2026
$0.35
Quarterly
Record Aug 6, 2026 · Payment Aug 20, 2026
Ex-dividend May 6, 2026
$0.35
Quarterly
Record May 6, 2026 · Payment May 21, 2026
Ex-dividend Feb 25, 2026
$0.35
Quarterly
Record Feb 25, 2026 · Payment Mar 12, 2026
Ex-dividend Nov 5, 2025
$0.35
Quarterly
Record Nov 5, 2025 · Payment Nov 20, 2025
Ex-dividend Aug 6, 2025
$0.315
Quarterly
Record Aug 6, 2025 · Payment Aug 21, 2025
Ex-dividend May 7, 2025
$0.315
Quarterly
Record May 7, 2025 · Payment May 22, 2025
AI-generated and delayed market data for informational and educational purposes only. Not investment advice.