読み込み中

NASDAQCommunication ServicesTelecommunications Services
最新データ
$20.585
−$0.075 · -0.36%
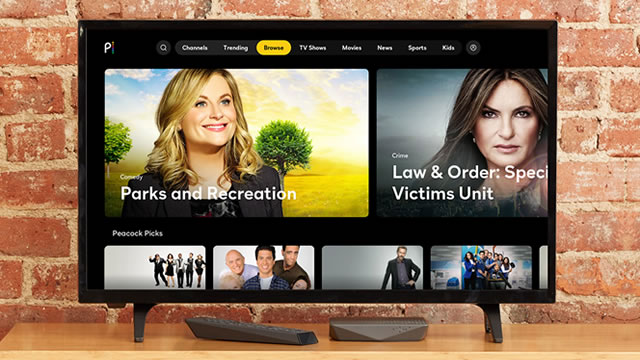
Comcast Corporation functions as a global media and technology conglomerate. Its diverse operations are segmented across Cable Communications, Media, Studios, Theme Parks, and Sky. The Cable Communications division delivers internet, television, phone, and mobile services to residential and business clients under its Xfinity brand, alongside offering advertising solutions. Its Media segment encompasses NBCUniversal's television and streaming platforms, including its national, regional, and international cable channels, the NBC and Telemundo broadcast networks, and the Peacock streaming service. The Studios segment is responsible for NBCUniversal's film and television production and distribution activities. Through its Theme Parks division, Comcast manages Universal Studios resorts located in Orlando, Florida; Hollywood, California; Osaka, Japan; and Beijing, China. The Sky segment provides direct-to-consumer services such as video, internet, voice, and mobile phone offerings, while its content arm includes entertainment networks, the Sky News channel, and Sky Sports networks. Additionally, Comcast owns the Philadelphia Flyers hockey team and the Wells Fargo Center arena in Philadelphia, Pennsylvania. Founded in 1963, Comcast Corporation is headquartered in Philadelphia, Pennsylvania.
通常取引
$20.5665
−$0.0935 · -0.45%
日中の時刻はETです。市場データは遅延する場合があります。
Comcast Corporation functions as a global media and technology conglomerate. Its diverse operations are segmented across Cable Communications, Media, Studios, Theme Parks, and Sky. The Cable Communications division delivers internet, television, phone, and mobile services to residential and business clients under its Xfinity brand, alongside offering advertising solutions. Its Media segment encompasses NBCUniversal's television and streaming platforms, including its national, regional, and international cable channels, the NBC and Telemundo broadcast networks, and the Peacock streaming service. The Studios segment is responsible for NBCUniversal's film and television production and distribution activities. Through its Theme Parks division, Comcast manages Universal Studios resorts located in Orlando, Florida; Hollywood, California; Osaka, Japan; and Beijing, China. The Sky segment provides direct-to-consumer services such as video, internet, voice, and mobile phone offerings, while its content arm includes entertainment networks, the Sky News channel, and Sky Sports networks. Additionally, Comcast owns the Philadelphia Flyers hockey team and the Wells Fargo Center arena in Philadelphia, Pennsylvania. Founded in 1963, Comcast Corporation is headquartered in Philadelphia, Pennsylvania.
日中レンジ
現在 $20.5665
52週レンジ
現在 $20.5665
日中の時刻はETです。市場データは遅延する場合があります。
GoAI スコア
買い
バリュエーション
98
大幅な割安
センチメント
79
強気
リスク
33
中程度のリスク
モメンタム
33
弱含み
GoAIの詳細リサーチ
詳しい根拠、カタリスト、リスクを確認できます。
Comcast Corporation functions as a global media and technology conglomerate. Its diverse operations are segmented across Cable Communications, Media, Studios, Theme Parks, and Sky. The Cable Communications division delivers internet, television, phone, and mobile services to residential and business clients under its Xfinity brand, alongside offering advertising solutions. Its Media segment encompasses NBCUniversal's television and streaming platforms, including its national, regional, and international cable channels, the NBC and Telemundo broadcast networks, and the Peacock streaming service. The Studios segment is responsible for NBCUniversal's film and television production and distribution activities. Through its Theme Parks division, Comcast manages Universal Studios resorts located in Orlando, Florida; Hollywood, California; Osaka, Japan; and Beijing, China. The Sky segment provides direct-to-consumer services such as video, internet, voice, and mobile phone offerings, while its content arm includes entertainment networks, the Sky News channel, and Sky Sports networks. Additionally, Comcast owns the Philadelphia Flyers hockey team and the Wells Fargo Center arena in Philadelphia, Pennsylvania. Founded in 1963, Comcast Corporation is headquartered in Philadelphia, Pennsylvania.
日中レンジ
現在 $20.5665
52週レンジ
現在 $20.5665
利用可能な期間全体で報告されたマージン。
売上高
営業利益
純利益
| 指標(USD) | 2025年度 | 2024年度 | 2023年度 | 2022年度 | 2021年度 |
|---|---|---|---|---|---|
| 売上高 | 1237.07億 USD | 1237.31億 USD | 1215.72億 USD | 1214.27億 USD | 1163.85億 USD |
| 売上原価 | 349.51億 USD | 370.26億 USD | 367.62億 USD | 382.13億 USD | 384.5億 USD |
| 粗利益 | 887.56億 USD | 867.05億 USD | 848.1億 USD | 832.14億 USD | 779.35億 USD |
| 販売・一般管理 | 88.62億 USD | 80.73億 USD | 79.71億 USD | 85.06億 USD | 76.95億 USD |
| 営業費用 | 680.86億 USD | 634.07億 USD | 614.97億 USD | 605.9億 USD | 571.18億 USD |
| 支払利息 | 44.09億 USD | 41.34億 USD | 40.87億 USD | 38.96億 USD | 42.81億 USD |
| 減価償却費と償却費 | 162.11億 USD | 148.02億 USD | 143.36億 USD | 138.21億 USD | 138.04億 USD |
| 営業利益 | 206.7億 USD | 232.98億 USD | 233.13億 USD | 226.24億 USD | 208.17億 USD |
| 純利益 | 199.98億 USD | 161.92億 USD | 153.88億 USD | 53.7億 USD | 141.59億 USD |
会社概要が更新されました 2026年10月12日.
直近の発表実績
直近の発表実績
第三者のアナリスト予想は変更される場合があり、GoAIの推奨ではありません。
平均目標
$27.68
上昇余地(34.59%)分割調整後の1株当たりの年間現金分配金。
$1.2805
2025年(通年)+39.4% 以来 2021
2026年(一部):$1.32
$0.9185
2,021
$0.9934
2,022
$1.0684
2,023
$1.1434
2,024
$1.2805
2,025
$1.32
2,026*
* 利用可能な配当履歴のうち、暦年の一部のみを含みます。
| 種別 | 配当落ち日 | 詳細 | 基準日 | 支払日 |
|---|---|---|---|---|
配当 | 2026年10月7日 | $0.33Quarterly | 2026年10月7日 | 2026年10月28日 |
配当 | 2026年7月1日 | $0.33Quarterly | 2026年7月1日 | 2026年7月22日 |
配当 | 2026年4月1日 | $0.33Irregular | 2026年4月1日 | 2026年4月22日 |
配当 | 2026年1月14日 | $0.33Quarterly | 2026年1月14日 | 2026年2月4日 |
配当 | 2025年10月1日 | $0.33Irregular | 2025年10月1日 | 2025年10月22日 |
配当 | 2025年7月2日 | $0.33Quarterly | 2025年7月2日 | 2025年7月23日 |
配当落ち 2026年10月7日
$0.33
Quarterly
2026年10月7日基準 · 支払日 2026年10月28日
配当落ち 2026年7月1日
$0.33
Quarterly
2026年7月1日基準 · 支払日 2026年7月22日
配当落ち 2026年4月1日
$0.33
Irregular
2026年4月1日基準 · 支払日 2026年4月22日
配当落ち 2026年1月14日
$0.33
Quarterly
2026年1月14日基準 · 支払日 2026年2月4日
配当落ち 2025年10月1日
$0.33
Irregular
2025年10月1日基準 · 支払日 2025年10月22日
配当落ち 2025年7月2日
$0.33
Quarterly
2025年7月2日基準 · 支払日 2025年7月23日
この株式へのエクスポージャーを報告している上場投資信託です。
 State Street SPDR S&P 500 ETF1557.T1448.46億0.11%129.43兆 JPY0.09%¥122,850+0.12%
 Vanguard Morningstar Total Stock Market ETFVTI30.14億0.13%2.3兆 USD0.03%$382+0.02%
 Vanguard S&P 500 ETFVOO25.19億0.14%1.8兆 USD0.03%$715.87+0.04%
 Schwab U.S. Dividend Equity ETFSCHD21.03億1.91%1103.15億 USD0.06%$33.17+0.39%
 Invesco QQQ Trust, Series 1QQQ15.25億0.31%5060.67億 USD0.18%$747.7-0.48%
 iShares Core S&P 500 ETFIVV9.72億0.11%8964.4億 USD0.03%$782.23+0.03%
 State Street Communication Services Select Sector SPDR ETFXLC9.58億4.01%238.85億 USD0.08%$111.53+1.04%
 State Street SPDR S&P 500 ETFSPY9.15億0.11%8172億 USD0.09%$778.78+0.03%State Street SPDR S&P 500 ETF1557.TVanguard Morningstar Total Stock Market ETFVTIVanguard S&P 500 ETFVOOSchwab U.S. Dividend Equity ETFSCHDInvesco QQQ Trust, Series 1QQQiShares Core S&P 500 ETFIVVState Street Communication Services Select Sector SPDR ETFXLCState Street SPDR S&P 500 ETFSPY
AIが生成した遅延市場データを、情報提供および教育目的で掲載しています。投資助言ではありません。