読み込み中
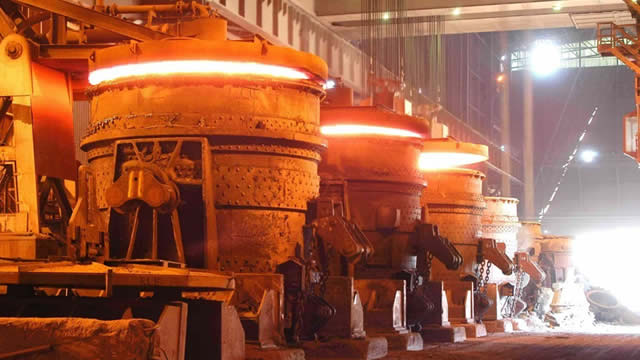
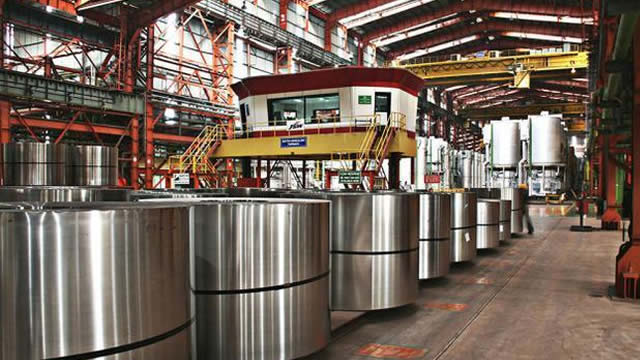
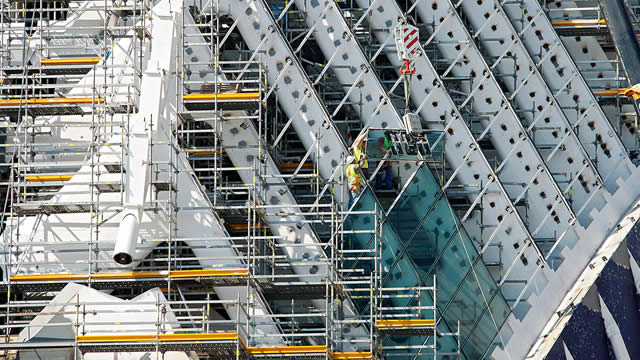
Ternium S.A. is an international steel enterprise engaged in the production, processing, and sale of a wide range of steel products. Its extensive market presence covers Mexico, Argentina, Brazil, the United States, and numerous other countries across Central and South America, including Paraguay, Chile, Bolivia, Uruguay, Colombia, Guatemala, Costa Rica, Honduras, El Salvador, and Nicaragua. The company operates through two primary divisions. Its Steel segment provides an exhaustive catalog of steel goods, from foundational products like slabs, billets, and hot-rolled flat items, to finished goods such as reinforcing bars, beams, tubes, and specialized building components like insulated panels, roofing, and pre-engineered metal systems. This segment also supplies pig iron and energy. The Mining segment concentrates on selling essential raw materials, specifically iron ore and pellets. In addition to its core manufacturing and mining activities, Ternium delivers medical, social, and engineering services, manages scrap, and acts as a significant distribution company. Its offerings cater to both large corporations and smaller enterprises across diverse sectors, including construction, automotive, home appliances, agriculture, packaging, transport, and energy. Founded in 1961 and based in Luxembourg City, Luxembourg, Ternium S.A. is a subsidiary of Techint Holdings S.à r.l.
前日終値
$58.18
+$1.71 · +3.03%
日中の時刻はETです。市場データは遅延する場合があります。
Ternium S.A. is an international steel enterprise engaged in the production, processing, and sale of a wide range of steel products. Its extensive market presence covers Mexico, Argentina, Brazil, the United States, and numerous other countries across Central and South America, including Paraguay, Chile, Bolivia, Uruguay, Colombia, Guatemala, Costa Rica, Honduras, El Salvador, and Nicaragua. The company operates through two primary divisions. Its Steel segment provides an exhaustive catalog of steel goods, from foundational products like slabs, billets, and hot-rolled flat items, to finished goods such as reinforcing bars, beams, tubes, and specialized building components like insulated panels, roofing, and pre-engineered metal systems. This segment also supplies pig iron and energy. The Mining segment concentrates on selling essential raw materials, specifically iron ore and pellets. In addition to its core manufacturing and mining activities, Ternium delivers medical, social, and engineering services, manages scrap, and acts as a significant distribution company. Its offerings cater to both large corporations and smaller enterprises across diverse sectors, including construction, automotive, home appliances, agriculture, packaging, transport, and energy. Founded in 1961 and based in Luxembourg City, Luxembourg, Ternium S.A. is a subsidiary of Techint Holdings S.à r.l.
日中レンジ
現在 $58.18
52週レンジ
現在 $58.18
日中の時刻はETです。市場データは遅延する場合があります。
GoAI スコア
買い
バリュエーション
77
割安
センチメント
64
強気
リスク
36
中程度のリスク
モメンタム
54
中立
GoAIの詳細リサーチ
詳しい根拠、カタリスト、リスクを確認できます。
Ternium S.A. is an international steel enterprise engaged in the production, processing, and sale of a wide range of steel products. Its extensive market presence covers Mexico, Argentina, Brazil, the United States, and numerous other countries across Central and South America, including Paraguay, Chile, Bolivia, Uruguay, Colombia, Guatemala, Costa Rica, Honduras, El Salvador, and Nicaragua. The company operates through two primary divisions. Its Steel segment provides an exhaustive catalog of steel goods, from foundational products like slabs, billets, and hot-rolled flat items, to finished goods such as reinforcing bars, beams, tubes, and specialized building components like insulated panels, roofing, and pre-engineered metal systems. This segment also supplies pig iron and energy. The Mining segment concentrates on selling essential raw materials, specifically iron ore and pellets. In addition to its core manufacturing and mining activities, Ternium delivers medical, social, and engineering services, manages scrap, and acts as a significant distribution company. Its offerings cater to both large corporations and smaller enterprises across diverse sectors, including construction, automotive, home appliances, agriculture, packaging, transport, and energy. Founded in 1961 and based in Luxembourg City, Luxembourg, Ternium S.A. is a subsidiary of Techint Holdings S.à r.l.
日中レンジ
現在 $58.18
52週レンジ
現在 $58.18
利用可能な期間全体で報告されたマージン。
売上高
営業利益
純利益
| 指標(USD) | 2025年度 | 2024年度 | 2023年度 | 2022年度 | 2021年度 |
|---|---|---|---|---|---|
| 売上高 | 156.09億 USD | 176.49億 USD | 176.1億 USD | 164.14億 USD | 160.91億 USD |
| 売上原価 | 132.56億 USD | 147.6億 USD | 123.54億 USD | 124.87億 USD | 98.95億 USD |
| 粗利益 | 23.41億 USD | 28.89億 USD | 52.56億 USD | 39.27億 USD | 61.96億 USD |
| 研究開発 | 2180万 USD | — | — | — | — |
| 販売・一般管理 | 13.54億 USD | 14.17億 USD | 11.21億 USD | 9.25億 USD | 7.29億 USD |
| 営業費用 | 16.35億 USD | 16.26億 USD | 30.58億 USD | 12.28億 USD | 9.25億 USD |
| 受取利息 | 2.38億 USD | 2.97億 USD | 2.76億 USD | 7566.22万 USD | 6265.58万 USD |
| 支払利息 | 2.15億 USD | 1.96億 USD | 1.85億 USD | 4705.87万 USD | 2688.71万 USD |
| 減価償却費と償却費 | 7.88億 USD | 7.43億 USD | 6.58億 USD | 6.16億 USD | 5.92億 USD |
| 営業利益 | 7.05億 USD | 12.63億 USD | 21.98億 USD | 27億 USD | 52.71億 USD |
| 純利益 | 4.25億 USD | −5367.2万 USD | 6.76億 USD | 17.68億 USD | 38.25億 USD |
会社概要が更新されました 2026年10月10日.
直近の発表実績
直近の発表実績
第三者のアナリスト予想は変更される場合があり、GoAIの推奨ではありません。
平均目標
$57.17
下落余地(1.74%)分割調整後の1株当たりの年間現金分配金。
$2.70
2025年(通年)-6.9% 以来 2021
2026年(一部):$1.30
$2.90
2,021
$2.70
2,022
$2.90
2,023
$3.10
2,024
$2.70
2,025
$1.30
2,026*
* 利用可能な配当履歴のうち、暦年の一部のみを含みます。
| 種別 | 配当落ち日 | 詳細 | 基準日 | 支払日 |
|---|---|---|---|---|
配当 | 2026年5月14日 | $1.30Semi-Annual | 2026年5月14日 | 2026年5月20日 |
配当 | 2025年11月10日 | $0.90Semi-Annual | 2025年11月10日 | 2025年11月14日 |
配当 | 2025年5月9日 | $1.80Semi-Annual | 2025年5月9日 | 2025年5月19日 |
配当 | 2024年11月18日 | $0.90Semi-Annual | 2024年11月18日 | 2024年11月26日 |
配当 | 2024年5月2日 | $2.20Semi-Annual | 2024年5月3日 | 2024年5月13日 |
配当 | 2023年11月10日 | $1.10Semi-Annual | 2023年11月13日 | 2023年11月21日 |
配当落ち 2026年5月14日
$1.30
Semi-Annual
2026年5月14日基準 · 支払日 2026年5月20日
配当落ち 2025年11月10日
$0.90
Semi-Annual
2025年11月10日基準 · 支払日 2025年11月14日
配当落ち 2025年5月9日
$1.80
Semi-Annual
2025年5月9日基準 · 支払日 2025年5月19日
配当落ち 2024年11月18日
$0.90
Semi-Annual
2024年11月18日基準 · 支払日 2024年11月26日
配当落ち 2024年5月2日
$2.20
Semi-Annual
2024年5月3日基準 · 支払日 2024年5月13日
配当落ち 2023年11月10日
$1.10
Semi-Annual
2023年11月13日基準 · 支払日 2023年11月21日
この株式へのエクスポージャーを報告している上場投資信託です。
 iShares Emerging Markets Dividend ETFDVYE1232.1万1.02%12.06億 USD0.49%$35.31+1.23%
 State Street SPDR Portfolio Emerging Markets ETFSPEM331.76万0.02%175.23億 USD0.07%$52.21+1.32%
 Inspire Fidelis Multi Factor ETFFDLS243.26万0.97%2.5億 USD0.66%$42.23+0.67%
 ActivePassive International Equity ETFAPIE208.01万0.18%11.33億 USD0.45%$38.56+0.65%
 VanEck Steel ETFSLX194.56万1.24%1.59億 USD0.55%$103.8+1.81%
 Invesco RAFI Strategic US ETFIUS103.93万0.11%9.78億 USD0.19%$69.44+0.23%
 JPMorgan ActiveBuilders Emerging Markets Equity ETFJEMA94.02万0.05%17.6億 USD0.33%$62.38+1.26%
 Arrow Dow Jones Global Yield ETFGYLD34.47万0.89%3898.61万 USD0.75%$13.43+1.59%iShares Emerging Markets Dividend ETFDVYEState Street SPDR Portfolio Emerging Markets ETFSPEMInspire Fidelis Multi Factor ETFFDLSActivePassive International Equity ETFAPIEVanEck Steel ETFSLXInvesco RAFI Strategic US ETFIUSJPMorgan ActiveBuilders Emerging Markets Equity ETFJEMAArrow Dow Jones Global Yield ETFGYLD
AIが生成した遅延市場データを、情報提供および教育目的で掲載しています。投資助言ではありません。