Loading

NASDAQTechnologySemiconductors
Latest quote
$507.03
−$2.54 · -0.50%
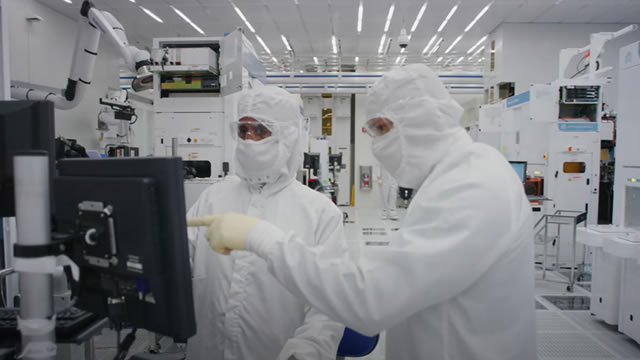
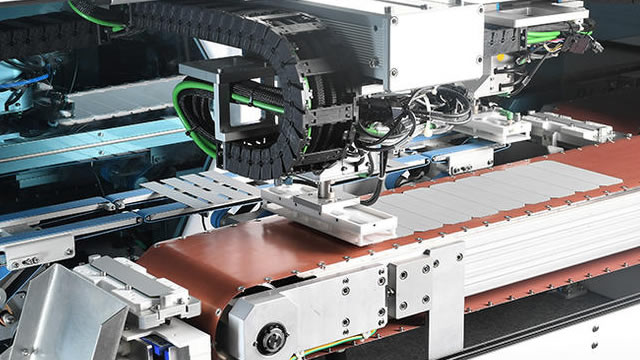
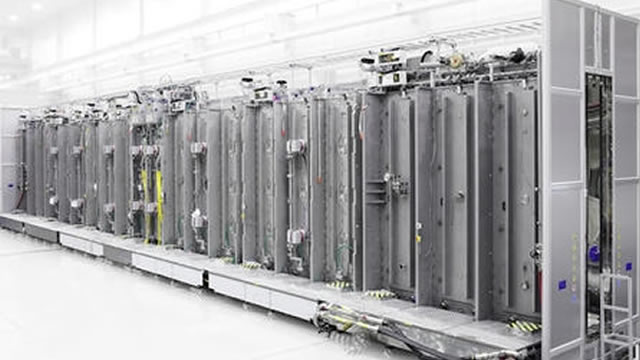
Applied Materials, Inc. engages in provision of materials engineering solutions used to produce semiconductors. The firm also focuses on design, development, production, and servicing of the critical wafer fabrication tools used for customers to manufacture semiconductors. It operates through the following segments: Semiconductor Systems and Applied Global Services (AGS). The Semiconductor Systems segment includes designing, development, manufacturing and sale of equipment used to fabricate semiconductor chips referred to as integrated circuits. The AGS segment engages in provision of services, spares, and factory automation software to customer fabrication plants globally. The company was founded on November 10, 1967 and is headquartered in Santa Clara, CA.
Previous close
$507.03
−$2.54 · -0.50%
After-hours
$507.16
+$0.13 · +0.03%
Oct 9, 7:59 PM ET
Regular session · ET · Market data may be delayed.
Applied Materials, Inc. engages in provision of materials engineering solutions used to produce semiconductors. The firm also focuses on design, development, production, and servicing of the critical wafer fabrication tools used for customers to manufacture semiconductors. It operates through the following segments: Semiconductor Systems and Applied Global Services (AGS). The Semiconductor Systems segment includes designing, development, manufacturing and sale of equipment used to fabricate semiconductor chips referred to as integrated circuits. The AGS segment engages in provision of services, spares, and factory automation software to customer fabrication plants globally. The company was founded on November 10, 1967 and is headquartered in Santa Clara, CA.
Day range
Current $507.03
52-week range
Current $507.03
Regular session · ET · Market data may be delayed.
GoAI Score
Hold
Valuation
66
Undervalued
Sentiment
49
Mixed
Risk
50
Elevated Risk
Momentum
63
Gaining
Full GoAI research
Thesis, catalysts, evidence, and risk analysis.
Applied Materials, Inc. engages in provision of materials engineering solutions used to produce semiconductors. The firm also focuses on design, development, production, and servicing of the critical wafer fabrication tools used for customers to manufacture semiconductors. It operates through the following segments: Semiconductor Systems and Applied Global Services (AGS). The Semiconductor Systems segment includes designing, development, manufacturing and sale of equipment used to fabricate semiconductor chips referred to as integrated circuits. The AGS segment engages in provision of services, spares, and factory automation software to customer fabrication plants globally. The company was founded on November 10, 1967 and is headquartered in Santa Clara, CA.
Day range
Current $507.03
52-week range
Current $507.03
Profitability as a percentage of reported revenue.
Revenue
Operating income
Net income
| Metric (USD) | FY2025 | FY2024 | FY2023 | FY2022 | FY2021 |
|---|---|---|---|---|---|
| Revenue | 28.37B USD | 27.18B USD | 26.52B USD | 25.79B USD | 23.06B USD |
| Cost of goods sold | 14.56B USD | 14.28B USD | 14.13B USD | 13.79B USD | 12.15B USD |
| Gross profit | 13.81B USD | 12.9B USD | 12.38B USD | 11.99B USD | 10.91B USD |
| Research and development | 3.57B USD | 3.23B USD | 3.1B USD | 2.77B USD | 2.49B USD |
| Selling, general, and administrative | 1.77B USD | 1.8B USD | 1.63B USD | 1.44B USD | 1.23B USD |
| Operating expenses | 5.52B USD | 5.03B USD | 4.73B USD | 4.21B USD | 4.03B USD |
| Interest income | — | 532M USD | 300M USD | 39M USD | 118M USD |
| Interest expense | 269M USD | 247M USD | 238M USD | 228M USD | 236M USD |
| Depreciation and amortization | 435M USD | 392M USD | 515M USD | 444M USD | 394M USD |
| Operating income | 8.29B USD | 7.87B USD | 7.65B USD | 7.79B USD | 6.89B USD |
| Net income | 7B USD | 7.18B USD | 6.86B USD | 6.53B USD | 5.89B USD |
Company facts updated Oct 10, 2026.
Recent quarterly results
Recent quarterly results
| Action | Effective date | Details | Record date | Payment date |
|---|---|---|---|---|
Stock split | Apr 17, 2002 | 2:1 | — | — |
Stock split | Mar 16, 2000 | 2:1 | — | — |
Stock split | Oct 14, 1997 | 2:1 | — | — |
Stock split | Oct 13, 1995 | 2:1 | — | — |
Stock split | Oct 6, 1993 | 2:1 | — | — |
Stock split | Apr 7, 1992 | 2:1 | — | — |
Effective Apr 17, 2002
2:1
Effective Mar 16, 2000
2:1
Effective Oct 14, 1997
2:1
Effective Oct 13, 1995
2:1
Effective Oct 6, 1993
2:1
Effective Apr 7, 1992
2:1
Funds reporting this stock among their holdings, ordered by reported position size.
 State Street SPDR S&P 500 ETF1557.T786.35B0.60%129.34T JPY0.09%¥122,850+0.12%
 Vanguard Morningstar Total Stock Market ETFVTI11.57B0.49%2.3T USD0.03%$381.94+0.63%
 Vanguard S&P 500 ETFVOO9.66B0.55%1.8T USD0.03%$715.59+0.61%
 Invesco QQQ Trust, Series 1QQQ8.39B1.68%500.69B USD0.18%$751.27+0.49%
 iShares Core S&P 500 ETFIVV5.38B0.60%892.79B USD0.03%$781.97+0.60%
 State Street SPDR S&P 500 ETFSPY4.97B0.60%817.2B USD0.09%$778.57+0.60%
 Vanguard Morningstar Growth ETFVUG3.8B0.99%384.6B USD0.03%$91.97+0.72%
 VanEck Semiconductor ETFSMH3.4B4.64%73.92B USD0.35%$603.33-0.65%State Street SPDR S&P 500 ETF1557.TVanguard Morningstar Total Stock Market ETFVTIVanguard S&P 500 ETFVOOInvesco QQQ Trust, Series 1QQQiShares Core S&P 500 ETFIVVState Street SPDR S&P 500 ETFSPYVanguard Morningstar Growth ETFVUGVanEck Semiconductor ETFSMH
AI-generated and delayed market data for informational and educational purposes only. Not investment advice.