Loading

NYSEConsumer DefensiveHousehold & Personal Products
Latest quote
$87.47
+$0.26 · +0.30%
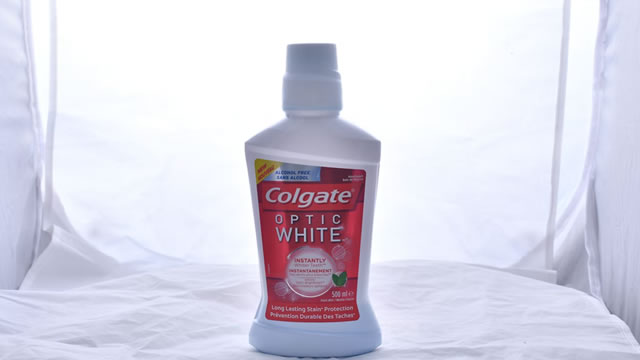
Operating globally, Colgate-Palmolive Company and its affiliated entities are engaged in the production and distribution of a diverse range of consumer goods. Its operations are structured into two primary divisions: Oral, Personal and Home Care, and Pet Nutrition. The Oral, Personal and Home Care division encompasses a broad array of offerings, spanning oral hygiene (e.g., toothpastes, toothbrushes, mouthwashes), personal care (e.g., bar and liquid soaps, shower gels, shampoos, conditioners, deodorants, antiperspirants, skin health items), and home care solutions (e.g., dishwashing detergents, fabric conditioners, household cleaners). These products are distributed through various channels, including traditional and online retailers, wholesalers, and distributors, under well-known brand names such as Colgate, Darlie, elmex, hello, meridol, Sorriso, Tom's of Maine, Irish Spring, Palmolive, Protex, Sanex, Softsoap, Lady Speed Stick, Speed Stick, EltaMD, Filorga, PCA SKIN, Ajax, Axion, Fabuloso, Murphy, Suavitel, Soupline, and Cuddly. Furthermore, this segment supplies specialized pharmaceutical products to dentists and other professionals in oral healthcare. Conversely, the Pet Nutrition segment focuses on providing specialized pet food. This includes everyday nutritional options marketed under the Hill's Science Diet brand, as well as therapeutic diets designed to assist in managing various health conditions in dogs and cats, sold under the Hill's Prescription Diet brand. Distribution for these pet nutrition items occurs via pet supply stores, veterinary clinics, and online retail platforms. Established in 1806, Colgate-Palmolive Company maintains its corporate headquarters in New York, New York.
Regular session
$87.48
+$0.27 · +0.31%
Regular session · ET · Market data may be delayed.
Operating globally, Colgate-Palmolive Company and its affiliated entities are engaged in the production and distribution of a diverse range of consumer goods. Its operations are structured into two primary divisions: Oral, Personal and Home Care, and Pet Nutrition. The Oral, Personal and Home Care division encompasses a broad array of offerings, spanning oral hygiene (e.g., toothpastes, toothbrushes, mouthwashes), personal care (e.g., bar and liquid soaps, shower gels, shampoos, conditioners, deodorants, antiperspirants, skin health items), and home care solutions (e.g., dishwashing detergents, fabric conditioners, household cleaners). These products are distributed through various channels, including traditional and online retailers, wholesalers, and distributors, under well-known brand names such as Colgate, Darlie, elmex, hello, meridol, Sorriso, Tom's of Maine, Irish Spring, Palmolive, Protex, Sanex, Softsoap, Lady Speed Stick, Speed Stick, EltaMD, Filorga, PCA SKIN, Ajax, Axion, Fabuloso, Murphy, Suavitel, Soupline, and Cuddly. Furthermore, this segment supplies specialized pharmaceutical products to dentists and other professionals in oral healthcare. Conversely, the Pet Nutrition segment focuses on providing specialized pet food. This includes everyday nutritional options marketed under the Hill's Science Diet brand, as well as therapeutic diets designed to assist in managing various health conditions in dogs and cats, sold under the Hill's Prescription Diet brand. Distribution for these pet nutrition items occurs via pet supply stores, veterinary clinics, and online retail platforms. Established in 1806, Colgate-Palmolive Company maintains its corporate headquarters in New York, New York.
Day range
Current $87.48
52-week range
Current $87.48
Regular session · ET · Market data may be delayed.
GoAI Score
Hold
Valuation
48
Fair Value
Sentiment
72
Bullish
Risk
20
Low Risk
Momentum
43
Neutral
Full GoAI research
Thesis, catalysts, evidence, and risk analysis.
Operating globally, Colgate-Palmolive Company and its affiliated entities are engaged in the production and distribution of a diverse range of consumer goods. Its operations are structured into two primary divisions: Oral, Personal and Home Care, and Pet Nutrition. The Oral, Personal and Home Care division encompasses a broad array of offerings, spanning oral hygiene (e.g., toothpastes, toothbrushes, mouthwashes), personal care (e.g., bar and liquid soaps, shower gels, shampoos, conditioners, deodorants, antiperspirants, skin health items), and home care solutions (e.g., dishwashing detergents, fabric conditioners, household cleaners). These products are distributed through various channels, including traditional and online retailers, wholesalers, and distributors, under well-known brand names such as Colgate, Darlie, elmex, hello, meridol, Sorriso, Tom's of Maine, Irish Spring, Palmolive, Protex, Sanex, Softsoap, Lady Speed Stick, Speed Stick, EltaMD, Filorga, PCA SKIN, Ajax, Axion, Fabuloso, Murphy, Suavitel, Soupline, and Cuddly. Furthermore, this segment supplies specialized pharmaceutical products to dentists and other professionals in oral healthcare. Conversely, the Pet Nutrition segment focuses on providing specialized pet food. This includes everyday nutritional options marketed under the Hill's Science Diet brand, as well as therapeutic diets designed to assist in managing various health conditions in dogs and cats, sold under the Hill's Prescription Diet brand. Distribution for these pet nutrition items occurs via pet supply stores, veterinary clinics, and online retail platforms. Established in 1806, Colgate-Palmolive Company maintains its corporate headquarters in New York, New York.
Day range
Current $87.48
52-week range
Current $87.48
Profitability as a percentage of reported revenue.
Revenue
Operating income
Net income
| Metric (USD) | FY2025 | FY2024 | FY2023 | FY2022 | FY2021 |
|---|---|---|---|---|---|
| Revenue | 20.38B USD | 20.1B USD | 19.46B USD | 17.97B USD | 17.42B USD |
| Cost of goods sold | 8.13B USD | 8B USD | 8.21B USD | 7.82B USD | 7.13B USD |
| Gross profit | 12.25B USD | 12.11B USD | 11.25B USD | 10.15B USD | 10.29B USD |
| Research and development | 366M USD | 355M USD | 343M USD | 320M USD | 307M USD |
| Selling, general, and administrative | 7.89B USD | 7.81B USD | 6.78B USD | 6.25B USD | 6.1B USD |
| Operating expenses | 8.95B USD | 7.72B USD | 7.12B USD | 6.57B USD | 6.41B USD |
| Interest income | 75M USD | 67M USD | 55M USD | 14M USD | 17M USD |
| Interest expense | 267M USD | 292M USD | 287M USD | 167M USD | 117M USD |
| Depreciation and amortization | 630M USD | 605M USD | 567M USD | 545M USD | 556M USD |
| Operating income | 3.31B USD | 4.38B USD | 4.13B USD | 3.59B USD | 3.89B USD |
| Net income | 2.13B USD | 2.89B USD | 2.3B USD | 1.79B USD | 2.17B USD |
Company facts updated Oct 8, 2026.
Recent quarterly results
Recent quarterly results
Third-party consensus; not a GoAI recommendation.
Average target
$98.11
12.15% upside| Action | Effective date | Details | Record date | Payment date |
|---|---|---|---|---|
Stock split | May 16, 2013 | 2:1 | — | — |
Stock split | Jul 1, 1999 | 2:1 | — | — |
Stock split | May 16, 1997 | 2:1 | — | — |
Stock split | May 16, 1991 | 2:1 | — | — |
Stock split | May 30, 1973 | 3:1 | — | — |
Effective May 16, 2013
2:1
Effective Jul 1, 1999
2:1
Effective May 16, 1997
2:1
Effective May 16, 1991
2:1
Effective May 30, 1973
3:1
Funds reporting this stock among their holdings, ordered by reported position size.
 State Street SPDR S&P 500 ETF1557.T133.93B0.10%129.41T JPY0.09%¥122,700-0.57%
 Vanguard Morningstar Total Stock Market ETFVTI2.28B0.10%2.3T USD0.03%$380.2-0.22%
 Vanguard S&P 500 ETFVOO1.91B0.11%1.8T USD0.03%$713.02-0.18%
 iShares Core S&P 500 ETFIVV924.98M0.10%899.63B USD0.03%$779.16-0.18%
 State Street SPDR S&P 500 ETFSPY846.62M0.10%819.04B USD0.09%$775.69-0.20%
 Vanguard Morningstar Value ETFVTV687.45M0.26%262.4B USD0.03%$218.14-0.03%
 State Street Consumer Staples Select Sector SPDR ETFXLP594.74M4.43%13.44B USD0.08%$82.875+1.44%
 Vanguard Dividend Appreciation ETFVIG406.85M0.31%132.4B USD0.04%$236.58-0.18%State Street SPDR S&P 500 ETF1557.TVanguard Morningstar Total Stock Market ETFVTIVanguard S&P 500 ETFVOOiShares Core S&P 500 ETFIVVState Street SPDR S&P 500 ETFSPYVanguard Morningstar Value ETFVTVState Street Consumer Staples Select Sector SPDR ETFXLPVanguard Dividend Appreciation ETFVIG
AI-generated and delayed market data for informational and educational purposes only. Not investment advice.