Loading
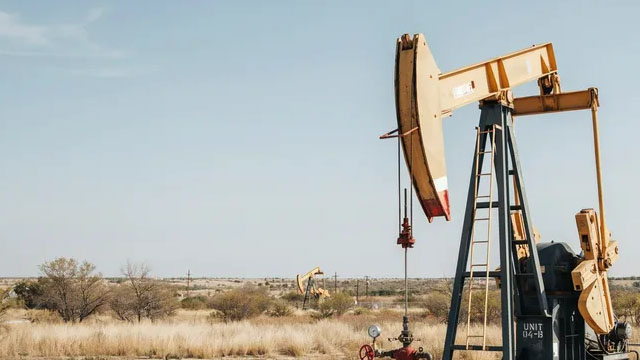
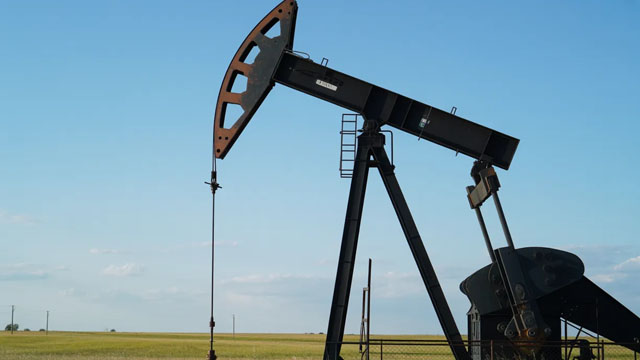
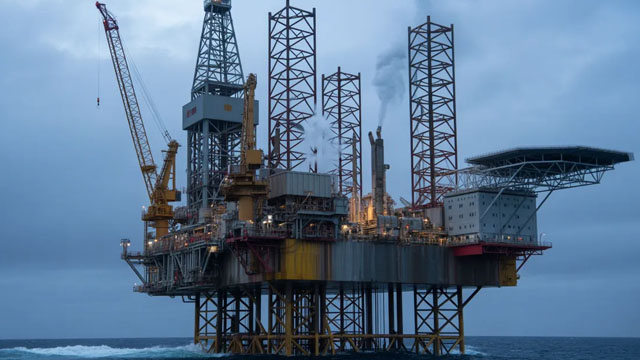
Cenovus Energy Inc. is a global energy firm that, through its subsidiaries, engages in the exploration, production, and marketing of crude oil, natural gas liquids, and natural gas across Canada, the United States, and the Asia Pacific region. Its diverse operations are organized into six distinct business units: Oil Sands, Conventional, Offshore, Canadian Manufacturing, U.S. Manufacturing, and Retail. The Oil Sands division is dedicated to the development and extraction of bitumen and heavy oil resources in northern Alberta and Saskatchewan, encompassing significant projects like Foster Creek, Christina Lake, Sunrise, and Tucker, alongside its Lloydminster thermal and conventional heavy oil operations. The Conventional segment manages assets predominantly located in Alberta and British Columbia, specifically in areas such as Elmworth-Wapiti, Kaybob-Edson, Clearwater, and Rainbow Lake, and also holds stakes in various natural gas processing facilities. The Offshore segment focuses on exploration and development initiatives. Within Canadian Manufacturing, the company oversees the Lloydminster upgrading and asphalt refining complex, which processes heavy oil and bitumen into synthetic crude, diesel, asphalt, and other ancillary products; this segment also manages the Bruderheim crude-by-rail terminal and two ethanol production facilities. The U.S. Manufacturing arm specializes in refining crude oil to yield products such as diesel, gasoline, jet fuel, and asphalt. Lastly, the Retail segment is responsible for distributing and selling both its own and third-party refined petroleum products through retail, commercial, bulk outlets, and wholesale channels. Cenovus Energy Inc. was established in 2009 and its corporate headquarters are located in Calgary, Canada.
Previous close
$27.07
−$0.09 · -0.33%
Regular session · ET · Market data may be delayed.
GoAI Score
Buy
Valuation
94
Deep Value
Sentiment
62
Bullish
Risk
33
Moderate Risk
Momentum
56
Neutral
Full GoAI research
Thesis, catalysts, evidence, and risk analysis.
Cenovus Energy Inc. is a global energy firm that, through its subsidiaries, engages in the exploration, production, and marketing of crude oil, natural gas liquids, and natural gas across Canada, the United States, and the Asia Pacific region. Its diverse operations are organized into six distinct business units: Oil Sands, Conventional, Offshore, Canadian Manufacturing, U.S. Manufacturing, and Retail. The Oil Sands division is dedicated to the development and extraction of bitumen and heavy oil resources in northern Alberta and Saskatchewan, encompassing significant projects like Foster Creek, Christina Lake, Sunrise, and Tucker, alongside its Lloydminster thermal and conventional heavy oil operations. The Conventional segment manages assets predominantly located in Alberta and British Columbia, specifically in areas such as Elmworth-Wapiti, Kaybob-Edson, Clearwater, and Rainbow Lake, and also holds stakes in various natural gas processing facilities. The Offshore segment focuses on exploration and development initiatives. Within Canadian Manufacturing, the company oversees the Lloydminster upgrading and asphalt refining complex, which processes heavy oil and bitumen into synthetic crude, diesel, asphalt, and other ancillary products; this segment also manages the Bruderheim crude-by-rail terminal and two ethanol production facilities. The U.S. Manufacturing arm specializes in refining crude oil to yield products such as diesel, gasoline, jet fuel, and asphalt. Lastly, the Retail segment is responsible for distributing and selling both its own and third-party refined petroleum products through retail, commercial, bulk outlets, and wholesale channels. Cenovus Energy Inc. was established in 2009 and its corporate headquarters are located in Calgary, Canada.
Day range
Current $27.07
52-week range
Current $27.07
Profitability as a percentage of reported revenue.
Revenue
Operating income
Net income
| Metric (CAD) | FY2025 | FY2024 | FY2023 | FY2022 | FY2021 |
|---|---|---|---|---|---|
| Revenue | 49.66B CAD | 57.73B CAD | 55.47B CAD | 71.77B CAD | 48.81B CAD |
| Cost of goods sold | 44.46B CAD | 44.96B CAD | 42.77B CAD | 54.63B CAD | 39.7B CAD |
| Gross profit | 5.19B CAD | 12.77B CAD | 12.7B CAD | 17.13B CAD | 9.11B CAD |
| Selling, general, and administrative | 811.34M CAD | 794M CAD | 688M CAD | 865M CAD | 849M CAD |
| Operating expenses | 811.34M CAD | 7.7B CAD | 7.08B CAD | 6.78B CAD | 5.58B CAD |
| Interest income | 140.89M CAD | 170M CAD | 217M CAD | 110M CAD | 23M CAD |
| Interest expense | 466.62M CAD | 649M CAD | 723M CAD | 812M CAD | 1.05B CAD |
| Depreciation and amortization | 5.43B CAD | 4.87B CAD | 4.62B CAD | 4.31B CAD | 4.32B CAD |
| Operating income | 4.38B CAD | 5.06B CAD | 5.62B CAD | 10.35B CAD | 3.52B CAD |
| Net income | 3.93B CAD | 3.14B CAD | 4.11B CAD | 6.45B CAD | 587M CAD |
Company facts updated Nov 22, 2026.
Recent quarterly results
Recent quarterly results
Third-party consensus; not a GoAI recommendation.
Average target
$29.00
7.13% upsideCash distributions grouped by calendar year; partial years are marked.
$0.5627
2025 complete year+709.6% since 2021
2026 partial: $0.461
$0.0695
2,021
$0.3512
2,022
$0.3901
2,023
$0.5927
2,024
$0.5627
2,025
$0.461
2,026*
* Partial calendar year in the available dividend history.
| Action | Ex-dividend date | Details | Record date | Payment date |
|---|---|---|---|---|
DividendUpcoming | Dec 15, 2026 | $0.1533Quarterly | Dec 15, 2026 | Dec 31, 2026 |
Dividend | Sep 15, 2026 | $0.1581Quarterly | Sep 15, 2026 | Sep 29, 2026 |
Dividend | Jun 15, 2026 | $0.1573Quarterly | Jun 15, 2026 | Jun 30, 2026 |
Dividend | Mar 13, 2026 | $0.1456Quarterly | Mar 13, 2026 | Mar 31, 2026 |
Dividend | Dec 15, 2025 | $0.1453Quarterly | Dec 15, 2025 | Dec 31, 2025 |
Dividend | Sep 15, 2025 | $0.1449Quarterly | Sep 15, 2025 | Sep 29, 2025 |
Ex-dividend Dec 15, 2026
$0.1533
Quarterly
Record Dec 15, 2026 · Payment Dec 31, 2026
Ex-dividend Sep 15, 2026
$0.1581
Quarterly
Record Sep 15, 2026 · Payment Sep 29, 2026
Ex-dividend Jun 15, 2026
$0.1573
Quarterly
Record Jun 15, 2026 · Payment Jun 30, 2026
Ex-dividend Mar 13, 2026
$0.1456
Quarterly
Record Mar 13, 2026 · Payment Mar 31, 2026
Ex-dividend Dec 15, 2025
$0.1453
Quarterly
Record Dec 15, 2025 · Payment Dec 31, 2025
Ex-dividend Sep 15, 2025
$0.1449
Quarterly
Record Sep 15, 2025 · Payment Sep 29, 2025
Funds reporting this stock among their holdings, ordered by reported position size.
 Dimensional - International Value ETFDFIV116.21M0.54%21.27B USD0.27%$52.68-2.23%
 Dimensional - International Core Equity 2 ETFDFIC34.87M0.24%14.49B USD0.22%$34.86-2.41%
 Dimensional International High Profitability ETFDIHP27.34M0.43%6.21B USD0.27%$31.59-2.35%
 Invesco S&P International Developed Momentum ETFIDMO20.78M0.54%3.71B USD0.25%$51.06-3.50%
 John Hancock Exchange Traded Fund Trust - John Hancock Discipline Value Select ETFJDVL20.76M2.09%965.93M USD0.56%$29.38-2.55%
 Dimensional - International Core Equity Market ETFDFAI18.06M0.10%17.21B USD0.18%$38.45-2.51%
 Dimensional World ex U.S. Core Equity 2 ETFDFAX15.3M0.13%11.28B USD0.28%$32.48-3.53%
 iShares Dynamic Equity Active ETFBDYN12.33M0.43%2.86B USD0.40%$24.6235-2.98%Dimensional - International Value ETFDFIVDimensional - International Core Equity 2 ETFDFICDimensional International High Profitability ETFDIHPInvesco S&P International Developed Momentum ETFIDMOJohn Hancock Exchange Traded Fund Trust - John Hancock Discipline Value Select ETFJDVLDimensional - International Core Equity Market ETFDFAIDimensional World ex U.S. Core Equity 2 ETFDFAXiShares Dynamic Equity Active ETFBDYN
AI-generated and delayed market data for informational and educational purposes only. Not investment advice.