Loading
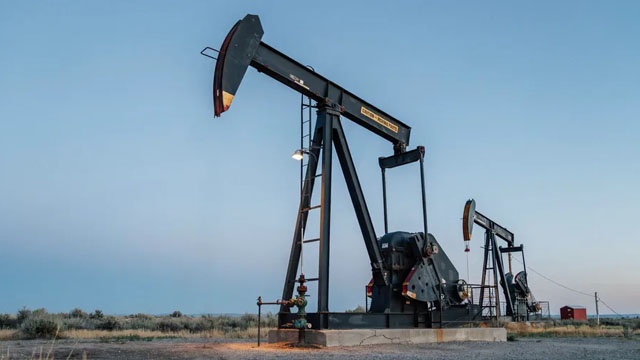
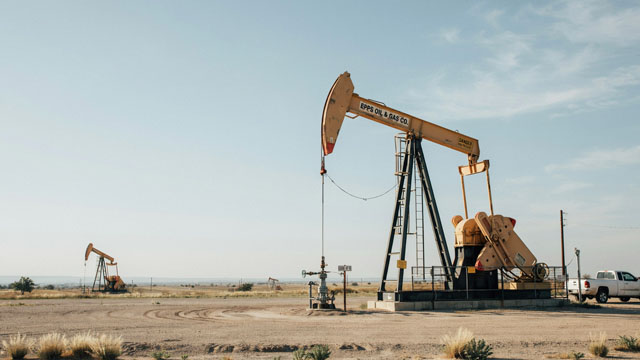
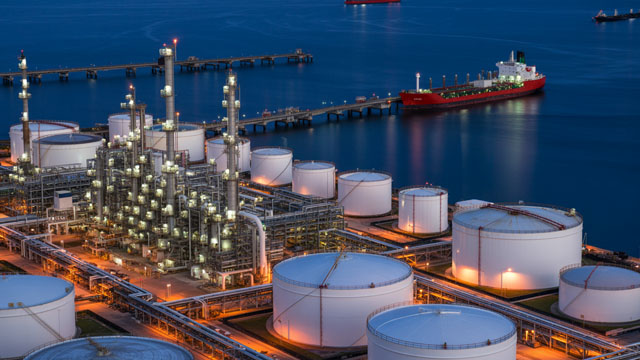
Eni S.p.A. is an international energy company primarily engaged in the discovery, development, and extraction of crude oil and natural gas resources. Its operations are organized into distinct divisions: Exploration & Production; Global Gas & LNG Portfolio; Refining & Marketing and Chemicals; Plenitude and Power; and Corporate and Other activities. The Exploration & Production division is responsible for the research, development, and output of oil, condensates, and natural gas, additionally undertaking initiatives in forestry conservation and carbon dioxide capture and storage. Its Global Gas & LNG Portfolio division oversees the procurement and wholesale distribution of natural gas via pipelines, including international transport, along with the acquisition and sale of liquefied natural gas (LNG). The Refining & Marketing and Chemicals segment manages the processing, supply, distribution, and commercialization of various fuels and chemical products. The Plenitude and Power segment, formerly known as Eni gas e luce, handles the retail provision of gas and electricity, alongside related services, and is involved in generating and wholesaling electricity from both thermoelectric and renewable power facilities. As of December 31, 2021, the company declared net proved reserves totaling 6,628 million barrels of oil equivalent and possessed an operational capacity of 4.5 gigawatts (GW). Established in 1953, Eni's corporate headquarters are situated in Rome, Italy.
Previous close
$53.96
−$0.59 · -1.08%
Pre-market
$54.95
+$0.99 · +1.83%
Oct 8, 5:19 AM ET
Regular session · ET · Market data may be delayed.
Eni S.p.A. is an international energy company primarily engaged in the discovery, development, and extraction of crude oil and natural gas resources. Its operations are organized into distinct divisions: Exploration & Production; Global Gas & LNG Portfolio; Refining & Marketing and Chemicals; Plenitude and Power; and Corporate and Other activities. The Exploration & Production division is responsible for the research, development, and output of oil, condensates, and natural gas, additionally undertaking initiatives in forestry conservation and carbon dioxide capture and storage. Its Global Gas & LNG Portfolio division oversees the procurement and wholesale distribution of natural gas via pipelines, including international transport, along with the acquisition and sale of liquefied natural gas (LNG). The Refining & Marketing and Chemicals segment manages the processing, supply, distribution, and commercialization of various fuels and chemical products. The Plenitude and Power segment, formerly known as Eni gas e luce, handles the retail provision of gas and electricity, alongside related services, and is involved in generating and wholesaling electricity from both thermoelectric and renewable power facilities. As of December 31, 2021, the company declared net proved reserves totaling 6,628 million barrels of oil equivalent and possessed an operational capacity of 4.5 gigawatts (GW). Established in 1953, Eni's corporate headquarters are situated in Rome, Italy.
Day range
Current $53.96
52-week range
Current $53.96
Regular session · ET · Market data may be delayed.
GoAI Score
Buy
Valuation
74
Undervalued
Sentiment
64
Bullish
Risk
26
Moderate Risk
Momentum
42
Neutral
Full GoAI research
Thesis, catalysts, evidence, and risk analysis.
Eni S.p.A. is an international energy company primarily engaged in the discovery, development, and extraction of crude oil and natural gas resources. Its operations are organized into distinct divisions: Exploration & Production; Global Gas & LNG Portfolio; Refining & Marketing and Chemicals; Plenitude and Power; and Corporate and Other activities. The Exploration & Production division is responsible for the research, development, and output of oil, condensates, and natural gas, additionally undertaking initiatives in forestry conservation and carbon dioxide capture and storage. Its Global Gas & LNG Portfolio division oversees the procurement and wholesale distribution of natural gas via pipelines, including international transport, along with the acquisition and sale of liquefied natural gas (LNG). The Refining & Marketing and Chemicals segment manages the processing, supply, distribution, and commercialization of various fuels and chemical products. The Plenitude and Power segment, formerly known as Eni gas e luce, handles the retail provision of gas and electricity, alongside related services, and is involved in generating and wholesaling electricity from both thermoelectric and renewable power facilities. As of December 31, 2021, the company declared net proved reserves totaling 6,628 million barrels of oil equivalent and possessed an operational capacity of 4.5 gigawatts (GW). Established in 1953, Eni's corporate headquarters are situated in Rome, Italy.
Day range
Current $53.96
52-week range
Current $53.96
Profitability as a percentage of reported revenue.
Revenue
Operating income
Net income
| Metric (EUR) | FY2025 | FY2024 | FY2023 | FY2022 | FY2021 |
|---|---|---|---|---|---|
| Revenue | 82.15B EUR | 88.8B EUR | 93.72B EUR | 132.51B EUR | 76.58B EUR |
| Cost of goods sold | 74.41B EUR | 77.26B EUR | 80.25B EUR | 105.59B EUR | 61.72B EUR |
| Gross profit | 7.75B EUR | 11.54B EUR | 13.47B EUR | 26.92B EUR | 14.85B EUR |
| Research and development | — | 178M EUR | 166M EUR | 164M EUR | 177M EUR |
| Selling, general, and administrative | 3.23B EUR | 3.58B EUR | 3.26B EUR | 4.16B EUR | 3.32B EUR |
| Operating expenses | 3.24B EUR | 1.38B EUR | 3.72B EUR | 6.18B EUR | 3.11B EUR |
| Interest income | 7.2B EUR | 499M EUR | 523M EUR | 194M EUR | 148M EUR |
| Interest expense | 8.17B EUR | 1.28B EUR | 1.05B EUR | 912M EUR | 873M EUR |
| Depreciation and amortization | 7.35B EUR | 7.86B EUR | 7.82B EUR | 7.4B EUR | 7.21B EUR |
| Operating income | 4.51B EUR | 10.16B EUR | 9.75B EUR | 20.74B EUR | 11.74B EUR |
| Net income | 2.61B EUR | 2.62B EUR | 4.77B EUR | 13.89B EUR | 5.82B EUR |
Company facts updated Oct 8, 2026.
Reported history and fiscal-year consensus
Reported history and fiscal-year consensus
Third-party consensus; not a GoAI recommendation.
Average target
$73.15
35.56% upsidePrice history unavailable
High $90.00Average $73.15Low $56.30| Action | Effective date | Details | Record date | Payment date |
|---|---|---|---|---|
Stock split | Jan 10, 2006 | 5:2 | — | — |
Stock split | Jun 18, 2001 | 1:2 | — | — |
Effective Jan 10, 2006
5:2
Effective Jun 18, 2001
1:2
AI-generated and delayed market data for informational and educational purposes only. Not investment advice.