Loading
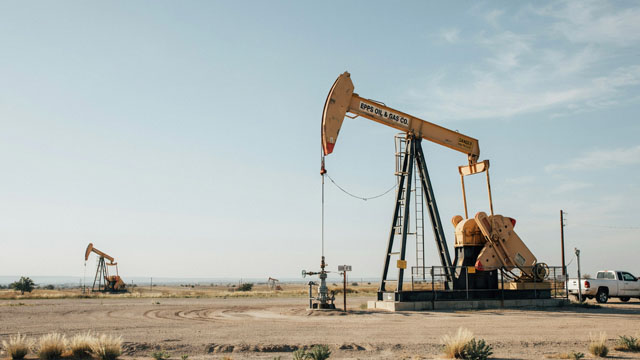
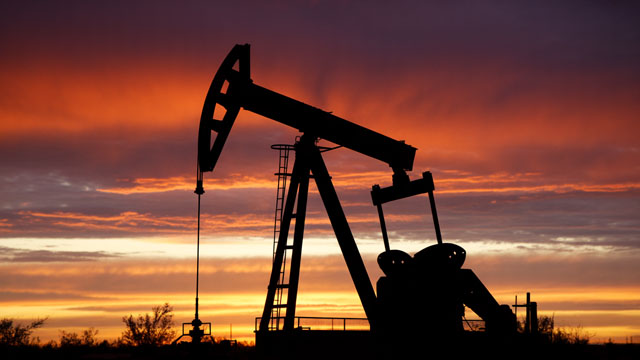
Helmerich & Payne, Inc., along with its affiliated companies, provides specialized drilling services and innovative solutions to businesses involved in the exploration and production of oil and gas. The company's operations are strategically organized into three distinct divisions: North America Solutions, Offshore Gulf of Mexico, and International Solutions. Within the North America Solutions segment, primary drilling activities are conducted across a broad geographical area, encompassing U.S. states such as Colorado, Louisiana, Montana, Nevada, New Mexico, North Dakota, Ohio, Oklahoma, Pennsylvania, Texas, Utah, West Virginia, and Wyoming. This division also actively pursues the development, promotion, and commercialization of advanced technologies designed to enhance drilling efficiency, wellbore quality, and accurate placement. The Offshore Gulf of Mexico segment focuses its drilling endeavors in Louisiana and within the federal waters of the U.S. Gulf of Mexico. Internationally, the Solutions segment manages drilling projects in various countries, including Argentina, Bahrain, Colombia, and the United Arab Emirates. As of September 30, 2021, Helmerich & Payne commanded a substantial fleet, featuring 236 land rigs situated in North America, 30 land rigs operating internationally, and 7 offshore platform rigs. Beyond its core drilling operations, the company also maintains an interest in commercial real estate. Its property portfolio in Tulsa, Oklahoma, comprises a shopping center offering approximately 390,000 square feet of leasable space, alongside about 176 acres of undeveloped land. Helmerich & Payne, Inc. was founded in 1920 and continues to maintain its corporate headquarters in Tulsa, Oklahoma.
Latest quote
$40.19
+$0.55 · +1.39%
After-hours
$39.83
−$0.36 · -0.90%
Oct 8, 4:10 PM ET
Regular session · ET · Market data may be delayed.
Helmerich & Payne, Inc., along with its affiliated companies, provides specialized drilling services and innovative solutions to businesses involved in the exploration and production of oil and gas. The company's operations are strategically organized into three distinct divisions: North America Solutions, Offshore Gulf of Mexico, and International Solutions. Within the North America Solutions segment, primary drilling activities are conducted across a broad geographical area, encompassing U.S. states such as Colorado, Louisiana, Montana, Nevada, New Mexico, North Dakota, Ohio, Oklahoma, Pennsylvania, Texas, Utah, West Virginia, and Wyoming. This division also actively pursues the development, promotion, and commercialization of advanced technologies designed to enhance drilling efficiency, wellbore quality, and accurate placement. The Offshore Gulf of Mexico segment focuses its drilling endeavors in Louisiana and within the federal waters of the U.S. Gulf of Mexico. Internationally, the Solutions segment manages drilling projects in various countries, including Argentina, Bahrain, Colombia, and the United Arab Emirates. As of September 30, 2021, Helmerich & Payne commanded a substantial fleet, featuring 236 land rigs situated in North America, 30 land rigs operating internationally, and 7 offshore platform rigs. Beyond its core drilling operations, the company also maintains an interest in commercial real estate. Its property portfolio in Tulsa, Oklahoma, comprises a shopping center offering approximately 390,000 square feet of leasable space, alongside about 176 acres of undeveloped land. Helmerich & Payne, Inc. was founded in 1920 and continues to maintain its corporate headquarters in Tulsa, Oklahoma.
Day range
Current $40.19
52-week range
Current $40.19
Regular session · ET · Market data may be delayed.
GoAI Score
Hold
Valuation
58
Fair Value
Sentiment
44
Mixed
Risk
44
Elevated Risk
Momentum
39
Weakening
Full GoAI research
Thesis, catalysts, evidence, and risk analysis.
Helmerich & Payne, Inc., along with its affiliated companies, provides specialized drilling services and innovative solutions to businesses involved in the exploration and production of oil and gas. The company's operations are strategically organized into three distinct divisions: North America Solutions, Offshore Gulf of Mexico, and International Solutions. Within the North America Solutions segment, primary drilling activities are conducted across a broad geographical area, encompassing U.S. states such as Colorado, Louisiana, Montana, Nevada, New Mexico, North Dakota, Ohio, Oklahoma, Pennsylvania, Texas, Utah, West Virginia, and Wyoming. This division also actively pursues the development, promotion, and commercialization of advanced technologies designed to enhance drilling efficiency, wellbore quality, and accurate placement. The Offshore Gulf of Mexico segment focuses its drilling endeavors in Louisiana and within the federal waters of the U.S. Gulf of Mexico. Internationally, the Solutions segment manages drilling projects in various countries, including Argentina, Bahrain, Colombia, and the United Arab Emirates. As of September 30, 2021, Helmerich & Payne commanded a substantial fleet, featuring 236 land rigs situated in North America, 30 land rigs operating internationally, and 7 offshore platform rigs. Beyond its core drilling operations, the company also maintains an interest in commercial real estate. Its property portfolio in Tulsa, Oklahoma, comprises a shopping center offering approximately 390,000 square feet of leasable space, alongside about 176 acres of undeveloped land. Helmerich & Payne, Inc. was founded in 1920 and continues to maintain its corporate headquarters in Tulsa, Oklahoma.
Day range
Current $40.19
52-week range
Current $40.19
Profitability as a percentage of reported revenue.
Revenue
Operating income
Net income
| Metric (USD) | FY2025 | FY2024 | FY2023 | FY2022 | FY2021 |
|---|---|---|---|---|---|
| Revenue | 3.75B USD | 2.76B USD | 2.87B USD | 2.06B USD | 1.22B USD |
| Cost of goods sold | 3.19B USD | 2.03B USD | 2.1B USD | 1.83B USD | 1.37B USD |
| Gross profit | 553.5M USD | 729.04M USD | 775.01M USD | 229.19M USD | −153.76M USD |
| Research and development | 34.13M USD | 40.97M USD | 30.05M USD | 26.56M USD | 21.72M USD |
| Selling, general, and administrative | 287.05M USD | 244.88M USD | 206.66M USD | 182.37M USD | 172.2M USD |
| Operating expenses | 321.18M USD | 277.14M USD | 213.12M USD | 183.89M USD | 274.79M USD |
| Interest income | 35.21M USD | 41.17M USD | 28.39M USD | 18.09M USD | 10.25M USD |
| Interest expense | 107.81M USD | 29.09M USD | 17.28M USD | 19.2M USD | 23.96M USD |
| Depreciation and amortization | 625.09M USD | 397.34M USD | 382.31M USD | 403.17M USD | 419.73M USD |
| Operating income | 232.32M USD | 451.9M USD | 561.89M USD | 45.29M USD | −428.55M USD |
| Net income | −165.09M USD | 344.17M USD | 434.1M USD | 6.95M USD | −326.15M USD |
Company facts updated Oct 8, 2026.
Recent quarterly results
Recent quarterly results
Third-party consensus; not a GoAI recommendation.
Average target
$46.14
14.80% upsideCash distributions grouped by calendar year; partial years are marked.
$1.00
2025 complete year0.0% since 2021
2026 partial: $0.75
$1.00
2,021
$1.235
2,022
$1.875
2,023
$1.51
2,024
$1.00
2,025
$0.75
2,026*
* Partial calendar year in the available dividend history.
| Action | Ex-dividend date | Details | Record date | Payment date |
|---|---|---|---|---|
DividendUpcoming | Nov 18, 2026 | $0.25Quarterly | Nov 18, 2026 | Dec 2, 2026 |
Dividend | Aug 18, 2026 | $0.25Quarterly | Aug 18, 2026 | Sep 1, 2026 |
Dividend | May 18, 2026 | $0.25Quarterly | May 18, 2026 | Jun 1, 2026 |
Dividend | Feb 13, 2026 | $0.25Quarterly | Feb 13, 2026 | Feb 27, 2026 |
Dividend | Nov 18, 2025 | $0.25Quarterly | Nov 18, 2025 | Dec 2, 2025 |
Dividend | Aug 15, 2025 | $0.25Quarterly | Aug 15, 2025 | Aug 29, 2025 |
Ex-dividend Nov 18, 2026
$0.25
Quarterly
Record Nov 18, 2026 · Payment Dec 2, 2026
Ex-dividend Aug 18, 2026
$0.25
Quarterly
Record Aug 18, 2026 · Payment Sep 1, 2026
Ex-dividend May 18, 2026
$0.25
Quarterly
Record May 18, 2026 · Payment Jun 1, 2026
Ex-dividend Feb 13, 2026
$0.25
Quarterly
Record Feb 13, 2026 · Payment Feb 27, 2026
Ex-dividend Nov 18, 2025
$0.25
Quarterly
Record Nov 18, 2025 · Payment Dec 2, 2025
Ex-dividend Aug 15, 2025
$0.25
Quarterly
Record Aug 15, 2025 · Payment Aug 29, 2025
Funds reporting this stock among their holdings, ordered by reported position size.
 iShares Core S&P Small-Cap ETFIJR236.8M0.23%104.29B USD0.06%$137.31+0.17%
 Avantis U.S. Small Cap Value ETFAVUV141.28M0.46%30.54B USD0.25%$120.13+0.84%
 Vanguard Morningstar Total Stock Market ETFVTI124.72M0.01%2.3T USD0.03%$379.56-0.39%
 iShares Russell 2000 ETFIWM102.96M0.13%78.56B USD0.19%$277.57-0.05%
 Vanguard Morningstar Small-Cap ETFVB90.29M0.05%185.3B USD0.03%$287.63+0.23%
 U.S. Small Cap Value Portfolio ETF Class SharesDFSV77.28M0.29%26.69B USD0.33%$38.10+0.82%
 Dimensional - US Targeted Value ETFDFAT60.67M0.20%30B USD0.33%$67.56+0.72%
 Vanguard Extended Market ETFVXF50.63M0.05%95.4B USD0.05%$233.13-0.15%iShares Core S&P Small-Cap ETFIJRAvantis U.S. Small Cap Value ETFAVUVVanguard Morningstar Total Stock Market ETFVTIiShares Russell 2000 ETFIWMVanguard Morningstar Small-Cap ETFVBU.S. Small Cap Value Portfolio ETF Class SharesDFSVDimensional - US Targeted Value ETFDFATVanguard Extended Market ETFVXF
AI-generated and delayed market data for informational and educational purposes only. Not investment advice.