Loading
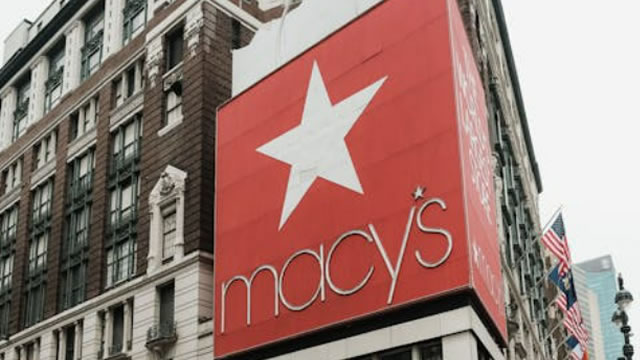
Macy's, Inc. is a prominent retail enterprise that employs an omnichannel strategy, serving customers through its extensive network of physical department stores, dedicated e-commerce websites, and convenient mobile applications. The company offers a broad assortment of merchandise, including apparel and accessories for men, women, and children, cosmetics, home furnishings, and other general consumer goods. As of January 29, 2022, Macy's operated 725 department stores domestically in locations such as the District of Columbia, Puerto Rico, and Guam. These stores are branded under several well-known names like Macy's, Macy's Backstage, Market by Macy's, Bloomingdale's, Bloomingdale's The Outlet, Bloomies, and the beauty retailer bluemercury. Internationally, Macy's also extends its reach through licensing agreements, with operations in Dubai, United Arab Emirates, and Al Zahra, Kuwait. The company maintains a presence in the beauty and spa retail sector. Originally established in 1830, the company was previously known as Federated Department Stores, Inc. It officially changed its name to Macy's, Inc. in June 2007, and its corporate headquarters are located in New York, New York.
Previous close
$22.67
−$0.12 · -0.53%
Regular session · ET · Market data may be delayed.
Macy's, Inc. is a prominent retail enterprise that employs an omnichannel strategy, serving customers through its extensive network of physical department stores, dedicated e-commerce websites, and convenient mobile applications. The company offers a broad assortment of merchandise, including apparel and accessories for men, women, and children, cosmetics, home furnishings, and other general consumer goods. As of January 29, 2022, Macy's operated 725 department stores domestically in locations such as the District of Columbia, Puerto Rico, and Guam. These stores are branded under several well-known names like Macy's, Macy's Backstage, Market by Macy's, Bloomingdale's, Bloomingdale's The Outlet, Bloomies, and the beauty retailer bluemercury. Internationally, Macy's also extends its reach through licensing agreements, with operations in Dubai, United Arab Emirates, and Al Zahra, Kuwait. The company maintains a presence in the beauty and spa retail sector. Originally established in 1830, the company was previously known as Federated Department Stores, Inc. It officially changed its name to Macy's, Inc. in June 2007, and its corporate headquarters are located in New York, New York.
Day range
Current $22.67
52-week range
Current $22.67
Regular session · ET · Market data may be delayed.
GoAI Score
Buy
Valuation
95
Deep Value
Sentiment
60
Mixed
Risk
47
Elevated Risk
Momentum
53
Neutral
Full GoAI research
Thesis, catalysts, evidence, and risk analysis.
Macy's, Inc. is a prominent retail enterprise that employs an omnichannel strategy, serving customers through its extensive network of physical department stores, dedicated e-commerce websites, and convenient mobile applications. The company offers a broad assortment of merchandise, including apparel and accessories for men, women, and children, cosmetics, home furnishings, and other general consumer goods. As of January 29, 2022, Macy's operated 725 department stores domestically in locations such as the District of Columbia, Puerto Rico, and Guam. These stores are branded under several well-known names like Macy's, Macy's Backstage, Market by Macy's, Bloomingdale's, Bloomingdale's The Outlet, Bloomies, and the beauty retailer bluemercury. Internationally, Macy's also extends its reach through licensing agreements, with operations in Dubai, United Arab Emirates, and Al Zahra, Kuwait. The company maintains a presence in the beauty and spa retail sector. Originally established in 1830, the company was previously known as Federated Department Stores, Inc. It officially changed its name to Macy's, Inc. in June 2007, and its corporate headquarters are located in New York, New York.
Day range
Current $22.67
52-week range
Current $22.67
Profitability as a percentage of reported revenue.
Revenue
Operating income
Net income
| Metric (USD) | FY2025 | FY2024 | FY2023 | FY2022 | FY2021 |
|---|---|---|---|---|---|
| Revenue | 22.62B USD | 23.01B USD | 23.87B USD | 25.45B USD | 25.4B USD |
| Cost of goods sold | 14.35B USD | 13.74B USD | 14.22B USD | 15.35B USD | 14.96B USD |
| Gross profit | 8.27B USD | 9.27B USD | 9.64B USD | 10.1B USD | 10.44B USD |
| Selling, general, and administrative | 8.24B USD | 8.33B USD | 8.38B USD | 8.46B USD | 8.15B USD |
| Operating expenses | 7.24B USD | 8.36B USD | 9.34B USD | 8.41B USD | 8.09B USD |
| Interest income | — | — | — | — | 3M USD |
| Interest expense | 97M USD | 115M USD | 135M USD | 162M USD | 259M USD |
| Depreciation and amortization | 894M USD | 881M USD | 897M USD | 857M USD | 874M USD |
| Operating income | 1.03B USD | 909M USD | 301M USD | 1.69B USD | 2.35B USD |
| Net income | 642M USD | 582M USD | 45M USD | 1.15B USD | 1.43B USD |
Company facts updated Oct 10, 2026.
Recent quarterly results
Recent quarterly results
Third-party consensus; not a GoAI recommendation.
Average target
$24.25
6.97% upsideCash distributions grouped by calendar year; partial years are marked.
$0.7296
2025 complete year-51.7% since 2019
2026 partial: $0.5745
$1.51
2,019
$0.63
2,022
$0.6616
2,023
$0.6948
2,024
$0.7296
2,025
$0.5745
2,026*
* Partial calendar year in the available dividend history.
| Action | Ex-dividend date | Details | Record date | Payment date |
|---|---|---|---|---|
Dividend | Sep 15, 2026 | $0.1915Quarterly | Sep 15, 2026 | Oct 1, 2026 |
Dividend | Jun 15, 2026 | $0.1915Quarterly | Jun 15, 2026 | Jul 1, 2026 |
Dividend | Mar 13, 2026 | $0.1915Quarterly | Mar 13, 2026 | Apr 1, 2026 |
Dividend | Dec 15, 2025 | $0.1824Quarterly | Dec 15, 2025 | Jan 2, 2026 |
Dividend | Sep 15, 2025 | $0.1824Quarterly | Sep 15, 2025 | Oct 1, 2025 |
Dividend | Jun 13, 2025 | $0.1824Quarterly | Jun 13, 2025 | Jul 1, 2025 |
Ex-dividend Sep 15, 2026
$0.1915
Quarterly
Record Sep 15, 2026 · Payment Oct 1, 2026
Ex-dividend Jun 15, 2026
$0.1915
Quarterly
Record Jun 15, 2026 · Payment Jul 1, 2026
Ex-dividend Mar 13, 2026
$0.1915
Quarterly
Record Mar 13, 2026 · Payment Apr 1, 2026
Ex-dividend Dec 15, 2025
$0.1824
Quarterly
Record Dec 15, 2025 · Payment Jan 2, 2026
Ex-dividend Sep 15, 2025
$0.1824
Quarterly
Record Sep 15, 2025 · Payment Oct 1, 2025
Ex-dividend Jun 13, 2025
$0.1824
Quarterly
Record Jun 13, 2025 · Payment Jul 1, 2025
Funds reporting this stock among their holdings, ordered by reported position size.
 Avantis U.S. Small Cap Value ETFAVUV231.26M0.75%30.82B USD0.25%$119.64-0.41%
 iShares Core S&P Mid-Cap ETFIJH214.99M0.18%122.71B USD0.05%$73.43+0.55%
 Schwab U.S. Dividend Equity ETFSCHD167.92M0.15%110.56B USD0.06%$33.04-0.32%
 Vanguard Morningstar Total Stock Market ETFVTI165.88M0.01%2.3T USD0.03%$381.94+0.63%
 Vanguard Morningstar Small-Cap ETFVB119.99M0.06%185.3B USD0.03%$289.48+0.64%
 U.S. Small Cap Value Portfolio ETF Class SharesDFSV116.9M0.43%26.81B USD0.33%$37.95-0.39%
 Dimensional - US Targeted Value ETFDFAT98.95M0.33%30.12B USD0.33%$67.27-0.43%
 Vanguard Morningstar Small-Cap Value ETFVBR76.17M0.11%68.2B USD0.05%$234.43+0.22%Avantis U.S. Small Cap Value ETFAVUViShares Core S&P Mid-Cap ETFIJHSchwab U.S. Dividend Equity ETFSCHDVanguard Morningstar Total Stock Market ETFVTIVanguard Morningstar Small-Cap ETFVBU.S. Small Cap Value Portfolio ETF Class SharesDFSVDimensional - US Targeted Value ETFDFATVanguard Morningstar Small-Cap Value ETFVBR
AI-generated and delayed market data for informational and educational purposes only. Not investment advice.