Loading
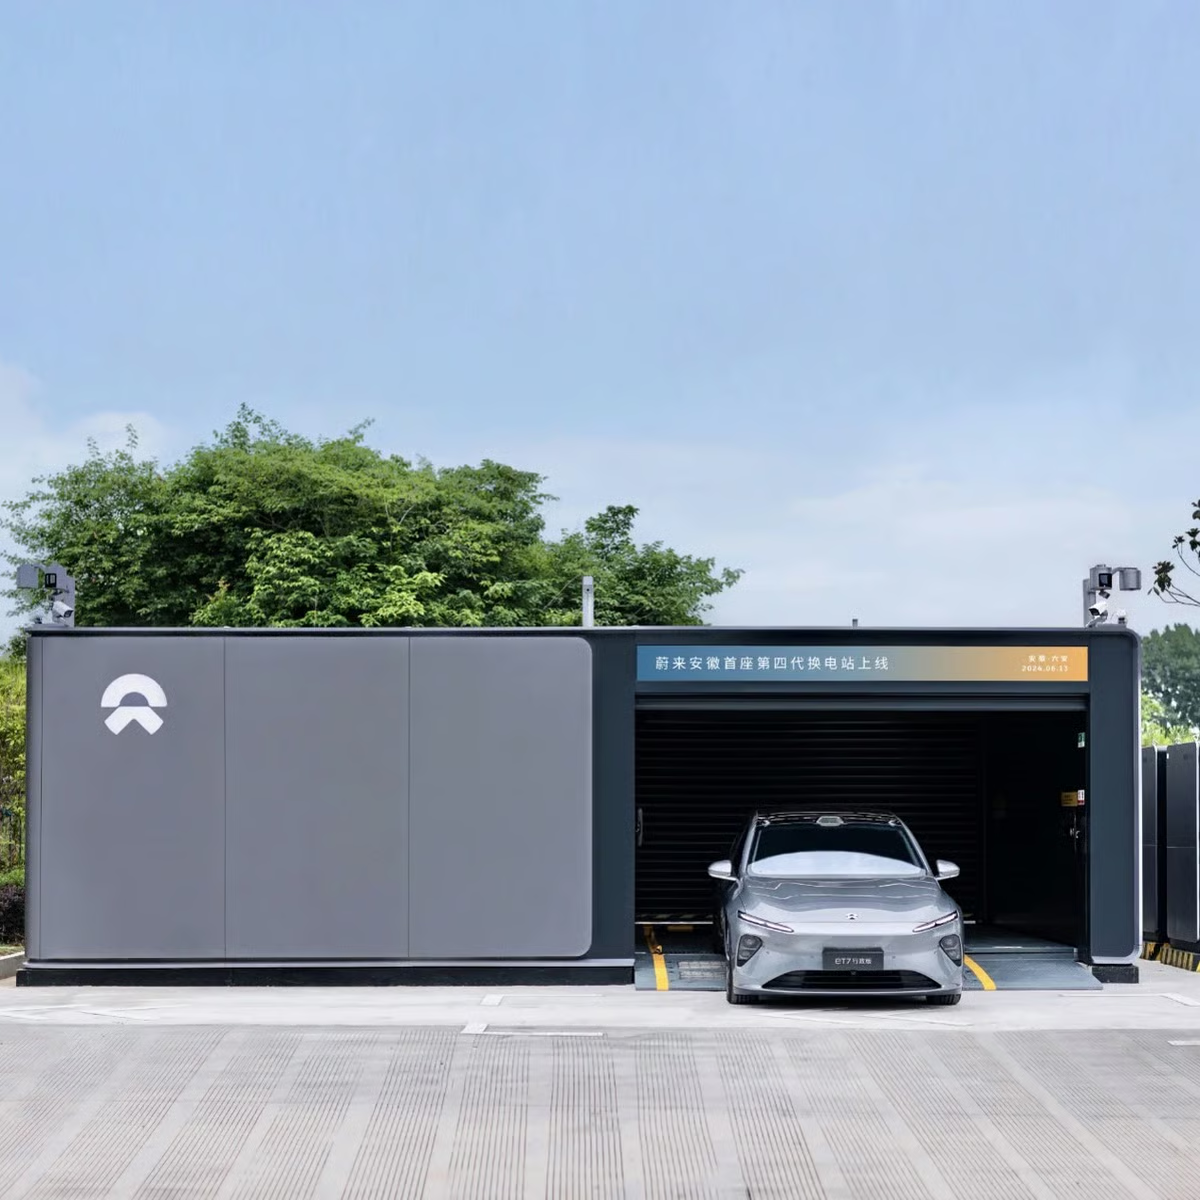
NIO Inc., a company based in Shanghai, China, specializes in the design, development, production, and sale of intelligent electric vehicles. Their product range includes five and six-seater electric SUVs, alongside smart electric sedans. Beyond manufacturing vehicles, NIO offers an extensive ecosystem of power solutions. These encompass home charging options (Power Home), an innovative battery swapping service (Power Swap), various public charging infrastructure like Power Charger and Destination Charger, and mobile charging vans (Power Mobile). Customers also benefit from the Power Map application, which provides real-time data on public charging networks, and the convenient One Click for Power valet charging service. The company provides a wide array of after-sales and customer support services. These include vehicle repairs, maintenance, and bodywork, available through both official NIO service centers and approved third-party facilities. They also facilitate insurance offerings, such as statutory, third-party liability, and vehicle damage policies, in collaboration with external insurers. Additional provisions cover roadside assistance, courtesy vehicle access, data package subscriptions, and automotive financing or leasing arrangements. Furthermore, NIO bundles energy and other service packages for its users. Internally, NIO is deeply involved in technological design and development, as well as the manufacturing of crucial electric vehicle components like e-powertrains and battery packs. They also oversee their sales and post-sales management operations. To complete its offerings, the company operates NIO Certified, a program dedicated to the inspection, evaluation, acquisition, and resale of pre-owned vehicles. Founded in 2014, the company was initially known as NextEV Inc. before officially changing its name to NIO Inc. in July 2017.
Latest quote
$3.41
−$0.13 · -3.67%
After-hours
$3.4002
−$0.0098 · -0.29%
Oct 8, 7:29 PM ET
Regular session · ET · Market data may be delayed.
NIO Inc., a company based in Shanghai, China, specializes in the design, development, production, and sale of intelligent electric vehicles. Their product range includes five and six-seater electric SUVs, alongside smart electric sedans. Beyond manufacturing vehicles, NIO offers an extensive ecosystem of power solutions. These encompass home charging options (Power Home), an innovative battery swapping service (Power Swap), various public charging infrastructure like Power Charger and Destination Charger, and mobile charging vans (Power Mobile). Customers also benefit from the Power Map application, which provides real-time data on public charging networks, and the convenient One Click for Power valet charging service. The company provides a wide array of after-sales and customer support services. These include vehicle repairs, maintenance, and bodywork, available through both official NIO service centers and approved third-party facilities. They also facilitate insurance offerings, such as statutory, third-party liability, and vehicle damage policies, in collaboration with external insurers. Additional provisions cover roadside assistance, courtesy vehicle access, data package subscriptions, and automotive financing or leasing arrangements. Furthermore, NIO bundles energy and other service packages for its users. Internally, NIO is deeply involved in technological design and development, as well as the manufacturing of crucial electric vehicle components like e-powertrains and battery packs. They also oversee their sales and post-sales management operations. To complete its offerings, the company operates NIO Certified, a program dedicated to the inspection, evaluation, acquisition, and resale of pre-owned vehicles. Founded in 2014, the company was initially known as NextEV Inc. before officially changing its name to NIO Inc. in July 2017.
Day range
Current $3.41
52-week range
Current $3.41
Regular session · ET · Market data may be delayed.
GoAI Score
Hold
Valuation
80
Undervalued
Sentiment
61
Bullish
Risk
55
Elevated Risk
Momentum
24
Weakening
Full GoAI research
Thesis, catalysts, evidence, and risk analysis.
NIO Inc., a company based in Shanghai, China, specializes in the design, development, production, and sale of intelligent electric vehicles. Their product range includes five and six-seater electric SUVs, alongside smart electric sedans. Beyond manufacturing vehicles, NIO offers an extensive ecosystem of power solutions. These encompass home charging options (Power Home), an innovative battery swapping service (Power Swap), various public charging infrastructure like Power Charger and Destination Charger, and mobile charging vans (Power Mobile). Customers also benefit from the Power Map application, which provides real-time data on public charging networks, and the convenient One Click for Power valet charging service. The company provides a wide array of after-sales and customer support services. These include vehicle repairs, maintenance, and bodywork, available through both official NIO service centers and approved third-party facilities. They also facilitate insurance offerings, such as statutory, third-party liability, and vehicle damage policies, in collaboration with external insurers. Additional provisions cover roadside assistance, courtesy vehicle access, data package subscriptions, and automotive financing or leasing arrangements. Furthermore, NIO bundles energy and other service packages for its users. Internally, NIO is deeply involved in technological design and development, as well as the manufacturing of crucial electric vehicle components like e-powertrains and battery packs. They also oversee their sales and post-sales management operations. To complete its offerings, the company operates NIO Certified, a program dedicated to the inspection, evaluation, acquisition, and resale of pre-owned vehicles. Founded in 2014, the company was initially known as NextEV Inc. before officially changing its name to NIO Inc. in July 2017.
Day range
Current $3.41
52-week range
Current $3.41
Profitability as a percentage of reported revenue.
Revenue
Operating income
Net income
| Metric (CNY) | FY2025 | FY2024 | FY2023 | FY2022 | FY2021 |
|---|---|---|---|---|---|
| Revenue | 87.49B CNY | 65.73B CNY | 55.62B CNY | 49.27B CNY | 36.14B CNY |
| Cost of goods sold | 75.57B CNY | 59.24B CNY | 52.57B CNY | 44.12B CNY | 29.31B CNY |
| Gross profit | 11.92B CNY | 6.49B CNY | 3.05B CNY | 5.14B CNY | 6.82B CNY |
| Research and development | 10.6B CNY | 13.04B CNY | 13.43B CNY | 10.84B CNY | 4.59B CNY |
| Selling, general, and administrative | 14.76B CNY | 14.45B CNY | 11.95B CNY | 9.72B CNY | 6.29B CNY |
| Operating expenses | 25.96B CNY | 28.37B CNY | 25.71B CNY | 20.78B CNY | 11.32B CNY |
| Interest income | 761.66M CNY | 853.73M CNY | 2.21B CNY | 1.36B CNY | 911.83M CNY |
| Interest expense | 885.25M CNY | 798.36M CNY | 403.53M CNY | 333.22M CNY | 637.41M CNY |
| Depreciation and amortization | 9.38B CNY | 7.7B CNY | 4.91B CNY | 3.99B CNY | 2.35B CNY |
| Operating income | −14.04B CNY | −21.87B CNY | −22.66B CNY | −15.64B CNY | −4.5B CNY |
| Net income | −14.96B CNY | −22.66B CNY | −21.15B CNY | −14.56B CNY | −10.57B CNY |
Company facts updated Oct 8, 2026.
Recent quarterly results
Recent quarterly results
Third-party consensus; not a GoAI recommendation.
Average target
$6.23
82.70% upsideFunds reporting this stock among their holdings, ordered by reported position size.
 State Street SPDR Portfolio Emerging Markets ETFSPEM7.63M0.04%17.88B USD0.07%$51.53-1.28%
 State Street SPDR S&P Kensho New Economies Composite ETFKOMP6.11M0.23%2.69B USD0.20%$65.61-1.19%
 Invesco WilderHill Clean Energy ETFPBW4.68M1.39%347.46M USD0.63%$28.29-2.18%
 Avantis Emerging Markets Equity ETFAVEM4.1M0.01%28.72B USD0.33%$93.24-1.80%
 Global X - Autonomous & Electric Vehicles ETFDRIV3.06M0.83%370.19M USD0.68%$32.6004-2.31%
 Invesco Golden Dragon China ETFPGJ2.87M3.49%82.05M USD0.70%$21.5842-0.67%
 VanEck Low Carbon Energy ETFSMOG1.81M1.39%130.09M USD0.64%$134.59-0.63%
 Invesco RAFI Emerging Markets ETFPXH1.74M0.08%2.09B USD0.47%$29.25-0.51%State Street SPDR Portfolio Emerging Markets ETFSPEMState Street SPDR S&P Kensho New Economies Composite ETFKOMPInvesco WilderHill Clean Energy ETFPBWAvantis Emerging Markets Equity ETFAVEMGlobal X - Autonomous & Electric Vehicles ETFDRIVInvesco Golden Dragon China ETFPGJVanEck Low Carbon Energy ETFSMOGInvesco RAFI Emerging Markets ETFPXH
AI-generated and delayed market data for informational and educational purposes only. Not investment advice.