Loading
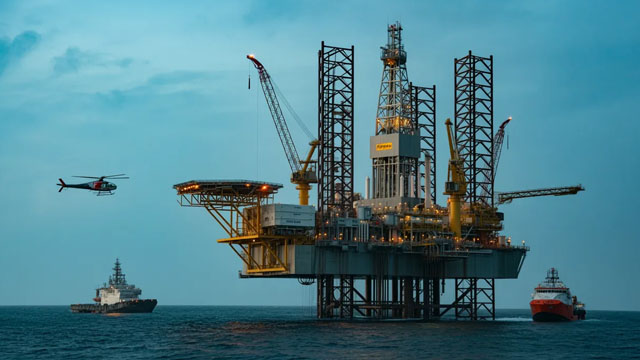
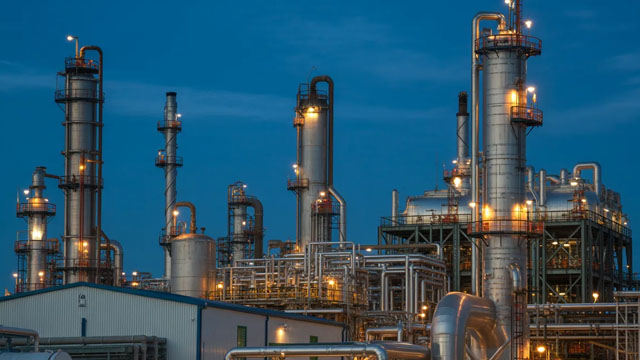
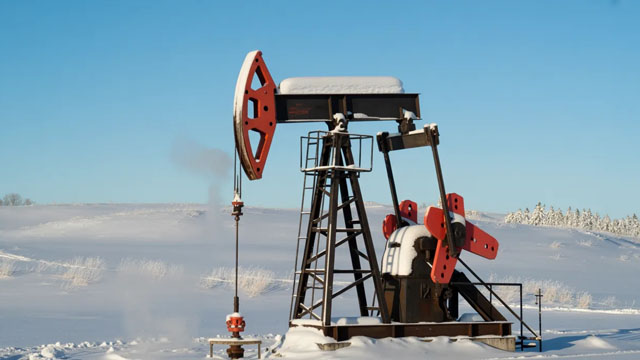
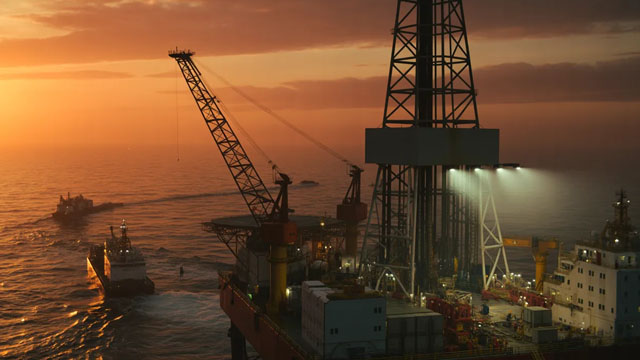
Suncor Energy Inc. operates as a fully integrated energy enterprise. Its primary focus involves the development of hydrocarbon resources, particularly within Canada's Athabasca oil sands region. Globally, the company undertakes the exploration, acquisition, development, production, transportation, refining, and marketing of crude oil. Domestically, it distributes petroleum and petrochemical products, predominantly under the Petro-Canada brand. Suncor's operations are divided into several key segments: The Oil Sands division extracts bitumen through both mining and in-situ techniques, converting it into refinery feedstock and diesel, or blending it for direct market sale. The Exploration and Production segment manages offshore assets off Canada's East Coast and in the North Sea, in addition to onshore properties in Libya and Syria. The Refining and Marketing segment processes crude oil and intermediate feedstocks into a variety of petroleum and petrochemical goods, which are then sold to retail, commercial, and industrial customers via its network of distributors. The Corporate and Eliminations segment also oversees the operation of four wind farms situated in Ontario and Western Canada. Beyond these core activities, Suncor is also engaged in the trading and marketing of crude oil, natural gas, various byproducts, refined products, and electricity. Established in 1917, the company was initially known as Suncor Inc. before officially changing its name to Suncor Energy Inc. in April 1997. Its corporate headquarters are located in Calgary, Canada.
Previous close
$68.14
−$0.08 · -0.12%
Pre-market
$69.10
+$0.96 · +1.41%
Oct 8, 4:53 AM ET
Regular session · ET · Market data may be delayed.
Suncor Energy Inc. operates as a fully integrated energy enterprise. Its primary focus involves the development of hydrocarbon resources, particularly within Canada's Athabasca oil sands region. Globally, the company undertakes the exploration, acquisition, development, production, transportation, refining, and marketing of crude oil. Domestically, it distributes petroleum and petrochemical products, predominantly under the Petro-Canada brand. Suncor's operations are divided into several key segments: The Oil Sands division extracts bitumen through both mining and in-situ techniques, converting it into refinery feedstock and diesel, or blending it for direct market sale. The Exploration and Production segment manages offshore assets off Canada's East Coast and in the North Sea, in addition to onshore properties in Libya and Syria. The Refining and Marketing segment processes crude oil and intermediate feedstocks into a variety of petroleum and petrochemical goods, which are then sold to retail, commercial, and industrial customers via its network of distributors. The Corporate and Eliminations segment also oversees the operation of four wind farms situated in Ontario and Western Canada. Beyond these core activities, Suncor is also engaged in the trading and marketing of crude oil, natural gas, various byproducts, refined products, and electricity. Established in 1917, the company was initially known as Suncor Inc. before officially changing its name to Suncor Energy Inc. in April 1997. Its corporate headquarters are located in Calgary, Canada.
Day range
Current $68.14
52-week range
Current $68.14
Regular session · ET · Market data may be delayed.
GoAI Score
Buy
Valuation
89
Deep Value
Sentiment
61
Bullish
Risk
30
Moderate Risk
Momentum
51
Neutral
Full GoAI research
Thesis, catalysts, evidence, and risk analysis.
Suncor Energy Inc. operates as a fully integrated energy enterprise. Its primary focus involves the development of hydrocarbon resources, particularly within Canada's Athabasca oil sands region. Globally, the company undertakes the exploration, acquisition, development, production, transportation, refining, and marketing of crude oil. Domestically, it distributes petroleum and petrochemical products, predominantly under the Petro-Canada brand. Suncor's operations are divided into several key segments: The Oil Sands division extracts bitumen through both mining and in-situ techniques, converting it into refinery feedstock and diesel, or blending it for direct market sale. The Exploration and Production segment manages offshore assets off Canada's East Coast and in the North Sea, in addition to onshore properties in Libya and Syria. The Refining and Marketing segment processes crude oil and intermediate feedstocks into a variety of petroleum and petrochemical goods, which are then sold to retail, commercial, and industrial customers via its network of distributors. The Corporate and Eliminations segment also oversees the operation of four wind farms situated in Ontario and Western Canada. Beyond these core activities, Suncor is also engaged in the trading and marketing of crude oil, natural gas, various byproducts, refined products, and electricity. Established in 1917, the company was initially known as Suncor Inc. before officially changing its name to Suncor Energy Inc. in April 1997. Its corporate headquarters are located in Calgary, Canada.
Day range
Current $68.14
52-week range
Current $68.14
Profitability as a percentage of reported revenue.
Revenue
Operating income
Net income
| Metric (CAD) | FY2025 | FY2024 | FY2023 | FY2022 | FY2021 |
|---|---|---|---|---|---|
| Revenue | 48.91B CAD | 50.69B CAD | 49.09B CAD | 58.34B CAD | 39.13B CAD |
| Cost of goods sold | 20.01B CAD | 20.96B CAD | 19.99B CAD | 22.45B CAD | 15.27B CAD |
| Gross profit | 28.89B CAD | 29.73B CAD | 29.1B CAD | 35.89B CAD | 23.86B CAD |
| Selling, general, and administrative | 13.4B CAD | 13.18B CAD | 13.19B CAD | 12.9B CAD | 11.3B CAD |
| Operating expenses | 13.4B CAD | 13.18B CAD | 13.19B CAD | 12.9B CAD | 11.3B CAD |
| Interest income | 191.84M CAD | — | 94.01M CAD | 149M CAD | 64M CAD |
| Interest expense | 742.4M CAD | 694M CAD | 775.07M CAD | 906M CAD | 961M CAD |
| Depreciation and amortization | 7.43B CAD | 6.95B CAD | 6.44B CAD | 8.79B CAD | 5.85B CAD |
| Operating income | 15.49B CAD | 16.56B CAD | 15.91B CAD | 22.99B CAD | 12.56B CAD |
| Net income | 5.92B CAD | 6.02B CAD | 8.3B CAD | 9.08B CAD | 4.12B CAD |
Company facts updated Oct 8, 2026.
Recent quarterly results
Recent quarterly results
Third-party consensus; not a GoAI recommendation.
Average target
$89.00
30.61% upsideCash distributions grouped by calendar year; partial years are marked.
$1.6582
2025 complete year+98.6% since 2021
2026 partial: $1.3049
$0.8348
2,021
$1.4478
2,022
$1.5541
2,023
$1.6064
2,024
$1.6582
2,025
$1.3049
2,026*
* Partial calendar year in the available dividend history.
| Action | Ex-dividend date | Details | Record date | Payment date |
|---|---|---|---|---|
Dividend | Sep 4, 2026 | $0.4337Quarterly | Sep 4, 2026 | Sep 25, 2026 |
Dividend | Jun 4, 2026 | $0.4319Quarterly | Jun 4, 2026 | Jun 25, 2026 |
Dividend | Mar 4, 2026 | $0.4393Quarterly | Mar 4, 2026 | Mar 25, 2026 |
Dividend | Dec 3, 2025 | $0.4301Quarterly | Dec 3, 2025 | Dec 24, 2025 |
Dividend | Sep 4, 2025 | $0.4122Quarterly | Sep 4, 2025 | Sep 25, 2025 |
Dividend | Jun 4, 2025 | $0.4138Quarterly | Jun 4, 2025 | Jun 25, 2025 |
Ex-dividend Sep 4, 2026
$0.4337
Quarterly
Record Sep 4, 2026 · Payment Sep 25, 2026
Ex-dividend Jun 4, 2026
$0.4319
Quarterly
Record Jun 4, 2026 · Payment Jun 25, 2026
Ex-dividend Mar 4, 2026
$0.4393
Quarterly
Record Mar 4, 2026 · Payment Mar 25, 2026
Ex-dividend Dec 3, 2025
$0.4301
Quarterly
Record Dec 3, 2025 · Payment Dec 24, 2025
Ex-dividend Sep 4, 2025
$0.4122
Quarterly
Record Sep 4, 2025 · Payment Sep 25, 2025
Ex-dividend Jun 4, 2025
$0.4138
Quarterly
Record Jun 4, 2025 · Payment Jun 25, 2025
Funds reporting this stock among their holdings, ordered by reported position size.
 Schwab International Equity ETFSCHF364.26M0.54%68.57B USD0.03%$27.26-1.23%
 State Street SPDR Portfolio Developed World ex-US ETFSPDW199.39M0.49%41.32B USD0.03%$49.95-1.21%
 Dimensional - International Value ETFDFIV188.54M0.89%21.68B USD0.27%$55.21-1.27%
 Schwab Fundamental International Large Company Index ETFFNDF72.45M0.28%25.62B USD0.25%$53.42-0.98%
 Dimensional - International Core Equity Market ETFDFAI57.97M0.33%17.93B USD0.18%$41.15-1.15%
 Principal Exchange-Traded Funds - Principal International Equity ETFPIEQ54.77M4.04%1.3B USD0.48%$35.69-0.70%
 Dimensional - International Core Equity 2 ETFDFIC54.68M0.37%15.2B USD0.22%$37.34-1.11%
 Invesco S&P International Developed Momentum ETFIDMO46.4M1.07%4.35B USD0.25%$60.51-2.02%Schwab International Equity ETFSCHFState Street SPDR Portfolio Developed World ex-US ETFSPDWDimensional - International Value ETFDFIVSchwab Fundamental International Large Company Index ETFFNDFDimensional - International Core Equity Market ETFDFAIPrincipal Exchange-Traded Funds - Principal International Equity ETFPIEQDimensional - International Core Equity 2 ETFDFICInvesco S&P International Developed Momentum ETFIDMO
AI-generated and delayed market data for informational and educational purposes only. Not investment advice.