Loading
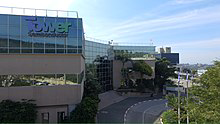
Tower Semiconductor Ltd. operates as a prominent independent semiconductor foundry, engaged in the worldwide production and sale of analog-intensive, mixed-signal semiconductor components. The company provides a comprehensive suite of customizable process technologies, including SiGe, BiCMOS, mixed signal/CMOS, RF CMOS, CMOS image sensors, integrated power management solutions, and MEMS. Furthermore, it offers wafer fabrication services, a design enablement platform to streamline the development process, and specialized services for process transfer optimization and new product development. Tower Semiconductor caters to both integrated device manufacturers and fabless companies, with its products serving a wide range of industries such as consumer electronics, computing, telecommunications, automotive, industrial, aerospace, defense, and medical devices. Established in 1993 and based in Migdal Haemek, Israel, its market reach extends across the United States, Japan, other Asian regions, and Europe.
NASDAQTechnologySemiconductors
Latest quote
$248.25
−$10.16 · -3.93%
Previous close
$248.25
−$10.16 · -3.93%
Pre-market
$240.13
−$8.12 · -3.27%
Oct 8, 6:10 AM ET
Regular session · ET · Market data may be delayed.
GoAI Score
Sell
Valuation
34
Expensive
Sentiment
63
Bullish
Risk
52
Elevated Risk
Momentum
40
Weakening
Full GoAI research
Thesis, catalysts, evidence, and risk analysis.
Tower Semiconductor Ltd. operates as a prominent independent semiconductor foundry, engaged in the worldwide production and sale of analog-intensive, mixed-signal semiconductor components. The company provides a comprehensive suite of customizable process technologies, including SiGe, BiCMOS, mixed signal/CMOS, RF CMOS, CMOS image sensors, integrated power management solutions, and MEMS. Furthermore, it offers wafer fabrication services, a design enablement platform to streamline the development process, and specialized services for process transfer optimization and new product development. Tower Semiconductor caters to both integrated device manufacturers and fabless companies, with its products serving a wide range of industries such as consumer electronics, computing, telecommunications, automotive, industrial, aerospace, defense, and medical devices. Established in 1993 and based in Migdal Haemek, Israel, its market reach extends across the United States, Japan, other Asian regions, and Europe.
Day range
Current $248.25
52-week range
Current $248.25
Profitability as a percentage of reported revenue.
Revenue
Operating income
Net income
| Metric (USD) | FY2025 | FY2024 | FY2023 | FY2022 | FY2021 |
|---|---|---|---|---|---|
| Revenue | 1.57B USD | 1.44B USD | 1.42B USD | 1.68B USD | 1.51B USD |
| Cost of goods sold | 1.2B USD | 1.1B USD | 1.07B USD | 1.21B USD | 1.18B USD |
| Gross profit | 363.85M USD | 339.44M USD | 353.52M USD | 466.31M USD | 329.12M USD |
| Research and development | 86.5M USD | 20.62M USD | 79.81M USD | 83.91M USD | 85.39M USD |
| Selling, general, and administrative | 83.19M USD | 74.96M USD | 72.45M USD | 80.28M USD | 77.22M USD |
| Operating expenses | 169.68M USD | 148.13M USD | −193.75M USD | 154.63M USD | 162.61M USD |
| Interest income | 46.21M USD | 55.49M USD | 39.99M USD | 13.6M USD | 5.37M USD |
| Interest expense | — | 5.86M USD | 4.44M USD | 5.69M USD | 11.69M USD |
| Depreciation and amortization | 303.11M USD | 266.28M USD | 258.02M USD | 292.64M USD | 270.71M USD |
| Operating income | 194.17M USD | 191.31M USD | 547.26M USD | 311.67M USD | 166.51M USD |
| Net income | 220.47M USD | 207.86M USD | 518.49M USD | 264.57M USD | 150.01M USD |
Company facts updated Oct 8, 2026.
Recent quarterly results
Recent quarterly results
Third-party consensus; not a GoAI recommendation.
Average target
$302
21.65% upsideCash distributions grouped by calendar year; partial years are marked.
$15.00
1997 complete year-32.7% since 1996
$22.2783
1,996
$15.00
1,997
| Action | Ex-dividend date | Details | Record date | Payment date |
|---|---|---|---|---|
Dividend | Sep 24, 1997 | $1.00Annual | Sep 26, 1997 | Oct 20, 1997 |
Dividend | Oct 30, 1996 | $1.4852Annual | Nov 1, 1996 | Nov 22, 1996 |
Ex-dividend Sep 24, 1997
$1.00
Annual
Record Sep 26, 1997 · Payment Oct 20, 1997
Ex-dividend Oct 30, 1996
$1.4852
Annual
Record Nov 1, 1996 · Payment Nov 22, 1996
Funds reporting this stock among their holdings, ordered by reported position size.
 iShares Semiconductor ETFSOXX628.9M1.29%48.6B USD0.33%$582.82-1.12%
 iShares A.I. Innovation and Tech Active ETFBAI327.29M2.14%15.27B USD0.65%$49.32-0.82%
 Direxion Daily Semiconductor Bull 3X ETFSOXL223.67M0.89%25.25B USD0.91%$158.91-3.26%
 Invesco Semiconductors ETFPSI89.66M2.83%3.17B USD0.55%$155.52-2.11%
 Defiance Quantum ETFQTUM70.06M1.20%5.92B USD0.40%$154.44-1.87%
 Schwab International Equity ETFSCHF69.99M0.10%68.57B USD0.03%$27.26-1.23%
 Invesco PHLX Semiconductor ETFSOXQ38.89M1.16%3.36B USD0.19%$102.78-1.20%
 State Street SPDR Portfolio Developed World ex-US ETFSPDW36.53M0.09%41.32B USD0.03%$49.95-1.21%iShares Semiconductor ETFSOXXiShares A.I. Innovation and Tech Active ETFBAIDirexion Daily Semiconductor Bull 3X ETFSOXLInvesco Semiconductors ETFPSIDefiance Quantum ETFQTUMSchwab International Equity ETFSCHFInvesco PHLX Semiconductor ETFSOXQState Street SPDR Portfolio Developed World ex-US ETFSPDW
AI-generated and delayed market data for informational and educational purposes only. Not investment advice.