Loading

NASDAQConsumer CyclicalAuto - Manufacturers
Latest quote
$382.7
+$7.70 · +2.05%
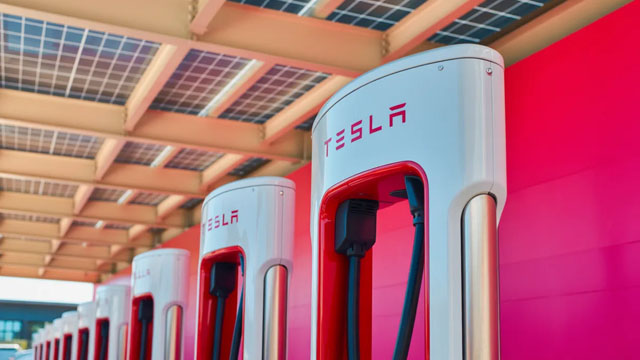
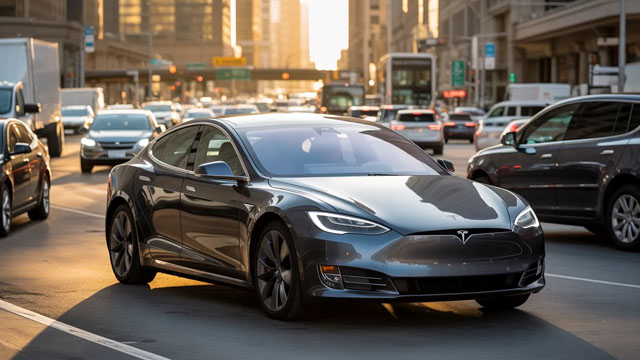
Tesla, Inc. operates globally, specializing in the creation, production, and distribution of electric vehicles, alongside comprehensive energy generation and storage solutions. Its market reach extends across the United States, China, and various other international regions. The company's operations are primarily divided into two main segments: its Automotive business and its Energy Generation and Storage division. Within its Automotive division, Tesla not only provides a range of electric cars but also generates revenue from selling automotive regulatory credits. This segment further encompasses a variety of post-sale services, including non-warranty vehicle support, sales of pre-owned vehicles, various retail products, and car insurance offerings. Customers can acquire Tesla's sedans and sport utility vehicles through direct sales, purchases of used vehicles, or via in-app upgrades often facilitated by the extensive Tesla Supercharger network. The company supports these acquisitions with financing and leasing options. Furthermore, it ensures vehicle upkeep through its proprietary service centers and a fleet of mobile technicians, complemented by both standard and extended vehicle warranty programs. The Energy Generation and Storage segment focuses on the development, manufacturing, setup, sale, and rental of solar power systems and energy storage products, along with associated services. This caters to a diverse clientele, spanning residential users, commercial enterprises, industrial entities, and public utilities. Distribution channels include Tesla's online platform, physical stores, galleries, and a network of collaborative partners. The company also offers servicing and repairs for its energy products, including warranty support, and provides multiple financing avenues for those investing in its solar solutions. Founded in 2003, the corporation was initially named Tesla Motors, Inc., before officially rebranding to Tesla, Inc. in February 2017. Its corporate headquarters are situated in Austin, Texas.
Previous close
$382.7
+$7.70 · +2.05%
Pre-market
$382.32
−$0.38 · -0.10%
Oct 12, 7:11 AM ET
Regular session · ET · Market data may be delayed.
Tesla, Inc. operates globally, specializing in the creation, production, and distribution of electric vehicles, alongside comprehensive energy generation and storage solutions. Its market reach extends across the United States, China, and various other international regions. The company's operations are primarily divided into two main segments: its Automotive business and its Energy Generation and Storage division. Within its Automotive division, Tesla not only provides a range of electric cars but also generates revenue from selling automotive regulatory credits. This segment further encompasses a variety of post-sale services, including non-warranty vehicle support, sales of pre-owned vehicles, various retail products, and car insurance offerings. Customers can acquire Tesla's sedans and sport utility vehicles through direct sales, purchases of used vehicles, or via in-app upgrades often facilitated by the extensive Tesla Supercharger network. The company supports these acquisitions with financing and leasing options. Furthermore, it ensures vehicle upkeep through its proprietary service centers and a fleet of mobile technicians, complemented by both standard and extended vehicle warranty programs. The Energy Generation and Storage segment focuses on the development, manufacturing, setup, sale, and rental of solar power systems and energy storage products, along with associated services. This caters to a diverse clientele, spanning residential users, commercial enterprises, industrial entities, and public utilities. Distribution channels include Tesla's online platform, physical stores, galleries, and a network of collaborative partners. The company also offers servicing and repairs for its energy products, including warranty support, and provides multiple financing avenues for those investing in its solar solutions. Founded in 2003, the corporation was initially named Tesla Motors, Inc., before officially rebranding to Tesla, Inc. in February 2017. Its corporate headquarters are situated in Austin, Texas.
Day range
Current $382.7
52-week range
Current $382.7
Regular session · ET · Market data may be delayed.
GoAI Score
Sell
Valuation
7
Overpriced
Sentiment
57
Mixed
Risk
52
Elevated Risk
Momentum
43
Neutral
Full GoAI research
Thesis, catalysts, evidence, and risk analysis.
Tesla, Inc. operates globally, specializing in the creation, production, and distribution of electric vehicles, alongside comprehensive energy generation and storage solutions. Its market reach extends across the United States, China, and various other international regions. The company's operations are primarily divided into two main segments: its Automotive business and its Energy Generation and Storage division. Within its Automotive division, Tesla not only provides a range of electric cars but also generates revenue from selling automotive regulatory credits. This segment further encompasses a variety of post-sale services, including non-warranty vehicle support, sales of pre-owned vehicles, various retail products, and car insurance offerings. Customers can acquire Tesla's sedans and sport utility vehicles through direct sales, purchases of used vehicles, or via in-app upgrades often facilitated by the extensive Tesla Supercharger network. The company supports these acquisitions with financing and leasing options. Furthermore, it ensures vehicle upkeep through its proprietary service centers and a fleet of mobile technicians, complemented by both standard and extended vehicle warranty programs. The Energy Generation and Storage segment focuses on the development, manufacturing, setup, sale, and rental of solar power systems and energy storage products, along with associated services. This caters to a diverse clientele, spanning residential users, commercial enterprises, industrial entities, and public utilities. Distribution channels include Tesla's online platform, physical stores, galleries, and a network of collaborative partners. The company also offers servicing and repairs for its energy products, including warranty support, and provides multiple financing avenues for those investing in its solar solutions. Founded in 2003, the corporation was initially named Tesla Motors, Inc., before officially rebranding to Tesla, Inc. in February 2017. Its corporate headquarters are situated in Austin, Texas.
Day range
Current $382.7
52-week range
Current $382.7
Profitability as a percentage of reported revenue.
Revenue
Operating income
Net income
| Metric (USD) | FY2025 | FY2024 | FY2023 | FY2022 | FY2021 |
|---|---|---|---|---|---|
| Revenue | 94.83B USD | 97.69B USD | 96.77B USD | 81.46B USD | 53.82B USD |
| Cost of goods sold | 77.73B USD | 80.24B USD | 79.11B USD | 60.61B USD | 40.22B USD |
| Gross profit | 17.09B USD | 17.45B USD | 17.66B USD | 20.85B USD | 13.61B USD |
| Research and development | 6.41B USD | 4.54B USD | 3.97B USD | 3.08B USD | 2.59B USD |
| Selling, general, and administrative | 5.83B USD | 5.15B USD | 4.8B USD | 3.95B USD | 4.52B USD |
| Operating expenses | 12.74B USD | 10.37B USD | 8.77B USD | 7.2B USD | 7.11B USD |
| Interest income | 1.68B USD | 1.57B USD | 1.07B USD | 297M USD | 56M USD |
| Interest expense | 338M USD | 350M USD | 156M USD | 191M USD | 371M USD |
| Depreciation and amortization | 6.15B USD | 5.37B USD | 4.67B USD | 3.54B USD | 2.91B USD |
| Operating income | 4.36B USD | 7.08B USD | 8.89B USD | 13.66B USD | 6.52B USD |
| Net income | 3.79B USD | 7.13B USD | 15B USD | 12.58B USD | 5.52B USD |
Company facts updated Oct 12, 2026.
Recent quarterly results
Recent quarterly results
Third-party consensus; not a GoAI recommendation.
| Action | Effective date | Details | Record date | Payment date |
|---|---|---|---|---|
Stock split | Aug 25, 2022 | 3:1 | — | — |
Stock split | Aug 31, 2020 | 5:1 | — | — |
Effective Aug 25, 2022
3:1
Effective Aug 31, 2020
5:1
Funds reporting this stock among their holdings, ordered by reported position size.
 State Street SPDR S&P 500 ETF1557.T2.04T1.58%129.43T JPY0.09%¥122,850+0.12%
 Vanguard Morningstar Total Stock Market ETFVTI32.94B1.40%2.3T USD0.03%$381.94+0.63%
 Vanguard S&P 500 ETFVOO27.52B1.56%1.8T USD0.03%$715.59+0.61%
 Invesco QQQ Trust, Series 1QQQ15.19B3.00%506.07B USD0.18%$751.27+0.49%
 iShares Core S&P 500 ETFIVV14.05B1.58%896.44B USD0.03%$781.97+0.60%
 State Street SPDR S&P 500 ETFSPY12.91B1.58%817.2B USD0.09%$778.57+0.60%
 Vanguard Morningstar Growth ETFVUG10.75B2.79%384.6B USD0.03%$91.97+0.72%
 iShares Russell 1000 Growth ETFIWF4.11B3.17%130.51B USD0.18%$127.91+0.63%State Street SPDR S&P 500 ETF1557.TVanguard Morningstar Total Stock Market ETFVTIVanguard S&P 500 ETFVOOInvesco QQQ Trust, Series 1QQQiShares Core S&P 500 ETFIVVState Street SPDR S&P 500 ETFSPYVanguard Morningstar Growth ETFVUGiShares Russell 1000 Growth ETFIWF
AI-generated and delayed market data for informational and educational purposes only. Not investment advice.