Loading
NASDAQConsumer CyclicalSpecialty Retail
Latest quote
$209.73
+$5.495 · +2.69%
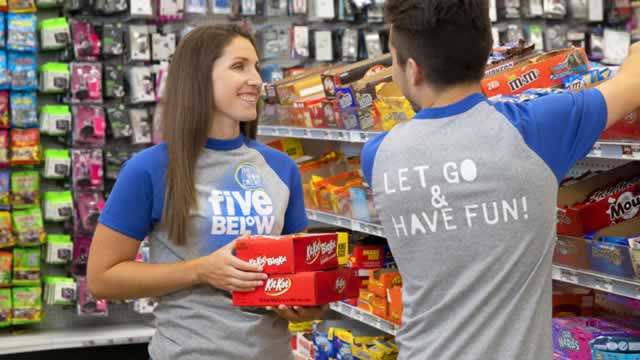
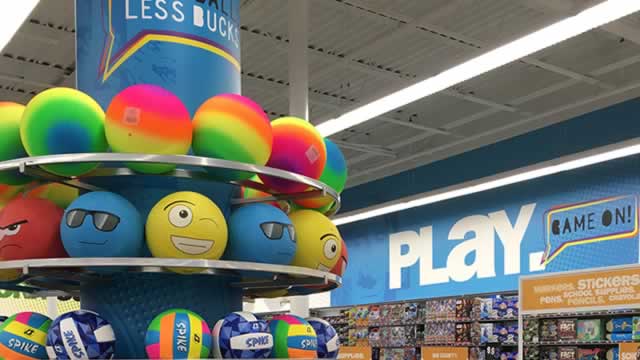
Five Below, Inc. operates as a prominent specialty discount retailer primarily serving the United States market. The company's diverse inventory spans a wide array of personal accessories, from fashionable novelty socks, sunglasses, and jewelry to scarves, gloves, hair accessories, and athletic apparel like tops, bottoms, and t-shirts. Shoppers can also find a comprehensive selection of beauty products, including nail polish, lip gloss, fragrances, and various branded cosmetics. For home and personal spaces, Five Below provides an assortment of items such as lamps, posters, picture frames, cozy fleece blankets, plush toys, pillows, candles, incense, and diverse lighting and novelty décor. This section also includes accent furniture and practical storage solutions. Athletic and recreational interests are covered with sports balls, team merchandise, and fitness essentials like hand weights, jump ropes, and gym balls. The store also boasts a variety of games, from classic board games and puzzles to collectibles and remote-control toys, alongside seasonal outdoor and water-based fun items for pools and beaches. Furthermore, the company caters to technology enthusiasts with accessories for cell phones, tablets, audio devices, and computers, offering cases, chargers, headphones, and related gadgets. Media products, including books, video games, and DVDs, are also available. Creativity is encouraged through a selection of craft activity kits and art supplies like crayons, markers, and stickers. Students can find school essentials such as backpacks, trendy notebooks and journals, novelty pens and pencils, and locker embellishments. For celebrations, Five Below offers party goods, decorations, gag gifts, and greeting cards, encompassing both everyday and special occasion merchandise. A sweet tooth is satisfied with a range of classic and novelty candy bars, movie-sized boxes, seasonal treats, gum, and snack foods, complemented by chilled beverages. Additionally, the retailer stocks a rotating selection of seasonally-themed items for holiday decorating and events. Initially founded as Cheap Holdings, Inc., the company officially adopted the name Five Below, Inc. in August 2002, the same year it was incorporated. Its corporate headquarters are situated in Philadelphia, Pennsylvania.
Latest quote
$209.73
+$5.495 · +2.69%
After-hours
$208.09
−$1.64 · -0.78%
Oct 8, 7:58 PM ET
Regular session · ET · Market data may be delayed.
Five Below, Inc. operates as a prominent specialty discount retailer primarily serving the United States market. The company's diverse inventory spans a wide array of personal accessories, from fashionable novelty socks, sunglasses, and jewelry to scarves, gloves, hair accessories, and athletic apparel like tops, bottoms, and t-shirts. Shoppers can also find a comprehensive selection of beauty products, including nail polish, lip gloss, fragrances, and various branded cosmetics. For home and personal spaces, Five Below provides an assortment of items such as lamps, posters, picture frames, cozy fleece blankets, plush toys, pillows, candles, incense, and diverse lighting and novelty décor. This section also includes accent furniture and practical storage solutions. Athletic and recreational interests are covered with sports balls, team merchandise, and fitness essentials like hand weights, jump ropes, and gym balls. The store also boasts a variety of games, from classic board games and puzzles to collectibles and remote-control toys, alongside seasonal outdoor and water-based fun items for pools and beaches. Furthermore, the company caters to technology enthusiasts with accessories for cell phones, tablets, audio devices, and computers, offering cases, chargers, headphones, and related gadgets. Media products, including books, video games, and DVDs, are also available. Creativity is encouraged through a selection of craft activity kits and art supplies like crayons, markers, and stickers. Students can find school essentials such as backpacks, trendy notebooks and journals, novelty pens and pencils, and locker embellishments. For celebrations, Five Below offers party goods, decorations, gag gifts, and greeting cards, encompassing both everyday and special occasion merchandise. A sweet tooth is satisfied with a range of classic and novelty candy bars, movie-sized boxes, seasonal treats, gum, and snack foods, complemented by chilled beverages. Additionally, the retailer stocks a rotating selection of seasonally-themed items for holiday decorating and events. Initially founded as Cheap Holdings, Inc., the company officially adopted the name Five Below, Inc. in August 2002, the same year it was incorporated. Its corporate headquarters are situated in Philadelphia, Pennsylvania.
Day range
Current $209.73
52-week range
Current $209.73
Regular session · ET · Market data may be delayed.
GoAI Score
Buy
Valuation
84
Deep Value
Sentiment
76
Bullish
Risk
49
Elevated Risk
Momentum
38
Weakening
Full GoAI research
Thesis, catalysts, evidence, and risk analysis.
Five Below, Inc. operates as a prominent specialty discount retailer primarily serving the United States market. The company's diverse inventory spans a wide array of personal accessories, from fashionable novelty socks, sunglasses, and jewelry to scarves, gloves, hair accessories, and athletic apparel like tops, bottoms, and t-shirts. Shoppers can also find a comprehensive selection of beauty products, including nail polish, lip gloss, fragrances, and various branded cosmetics. For home and personal spaces, Five Below provides an assortment of items such as lamps, posters, picture frames, cozy fleece blankets, plush toys, pillows, candles, incense, and diverse lighting and novelty décor. This section also includes accent furniture and practical storage solutions. Athletic and recreational interests are covered with sports balls, team merchandise, and fitness essentials like hand weights, jump ropes, and gym balls. The store also boasts a variety of games, from classic board games and puzzles to collectibles and remote-control toys, alongside seasonal outdoor and water-based fun items for pools and beaches. Furthermore, the company caters to technology enthusiasts with accessories for cell phones, tablets, audio devices, and computers, offering cases, chargers, headphones, and related gadgets. Media products, including books, video games, and DVDs, are also available. Creativity is encouraged through a selection of craft activity kits and art supplies like crayons, markers, and stickers. Students can find school essentials such as backpacks, trendy notebooks and journals, novelty pens and pencils, and locker embellishments. For celebrations, Five Below offers party goods, decorations, gag gifts, and greeting cards, encompassing both everyday and special occasion merchandise. A sweet tooth is satisfied with a range of classic and novelty candy bars, movie-sized boxes, seasonal treats, gum, and snack foods, complemented by chilled beverages. Additionally, the retailer stocks a rotating selection of seasonally-themed items for holiday decorating and events. Initially founded as Cheap Holdings, Inc., the company officially adopted the name Five Below, Inc. in August 2002, the same year it was incorporated. Its corporate headquarters are situated in Philadelphia, Pennsylvania.
Day range
Current $209.73
52-week range
Current $209.73
Profitability as a percentage of reported revenue.
Revenue
Operating income
Net income
| Metric (USD) | FY2025 | FY2024 | FY2023 | FY2022 | FY2021 |
|---|---|---|---|---|---|
| Revenue | 4.76B USD | 3.88B USD | 3.56B USD | 3.08B USD | 2.85B USD |
| Cost of goods sold | 3.24B USD | 2.52B USD | 2.29B USD | 1.98B USD | 1.82B USD |
| Gross profit | 1.52B USD | 1.35B USD | 1.27B USD | 1.1B USD | 1.03B USD |
| Selling, general, and administrative | 1.07B USD | 861.4M USD | 757.51M USD | 644.83M USD | 565.73M USD |
| Operating expenses | 1.07B USD | 1.03B USD | 888.25M USD | 750.45M USD | 650.56M USD |
| Interest income | 17M USD | 14.85M USD | 15.53M USD | — | — |
| Interest expense | — | — | — | — | 3.48M USD |
| Depreciation and amortization | 192.12M USD | 167.45M USD | 130.75M USD | 105.62M USD | 84.83M USD |
| Operating income | 457.4M USD | 323.82M USD | 385.57M USD | 345.04M USD | 379.88M USD |
| Net income | 358.64M USD | 253.61M USD | 301.11M USD | 261.53M USD | 278.81M USD |
Company facts updated Oct 9, 2026.
Recent quarterly results
Recent quarterly results
Third-party consensus; not a GoAI recommendation.
Average target
$298.44
42.30% upsideFunds reporting this stock among their holdings, ordered by reported position size.
 Vanguard Morningstar Total Stock Market ETFVTI434.06M0.02%2.3T USD0.03%$379.56-0.39%
 Vanguard Morningstar Small-Cap ETFVB314.07M0.17%185.3B USD0.03%$287.63+0.23%
 Vanguard Morningstar Small-Cap Growth ETFVBK180.25M0.39%44.7B USD0.05%$340.59-0.48%
 Vanguard Extended Market ETFVXF158.57M0.16%95.4B USD0.05%$233.13-0.15%
 State Street SPDR S&P MIDCAP 400 ETF TrustMDY85.53M0.33%25.98B USD0.23%$666.26+0.35%
 Invesco S&P MidCap Momentum ETFXMMO63.84M0.90%7.25B USD0.34%$147.38-0.63%
 State Street SPDR Portfolio S&P 400 Mid Cap ETFSPMD61.29M0.33%18.47B USD0.03%$63.97+0.33%
 Dimensional - US Small Cap ETFDFAS50.14M0.15%33.66B USD0.31%$78.10+0.23%Vanguard Morningstar Total Stock Market ETFVTIVanguard Morningstar Small-Cap ETFVBVanguard Morningstar Small-Cap Growth ETFVBKVanguard Extended Market ETFVXFState Street SPDR S&P MIDCAP 400 ETF TrustMDYInvesco S&P MidCap Momentum ETFXMMOState Street SPDR Portfolio S&P 400 Mid Cap ETFSPMDDimensional - US Small Cap ETFDFAS
AI-generated and delayed market data for informational and educational purposes only. Not investment advice.