加载中
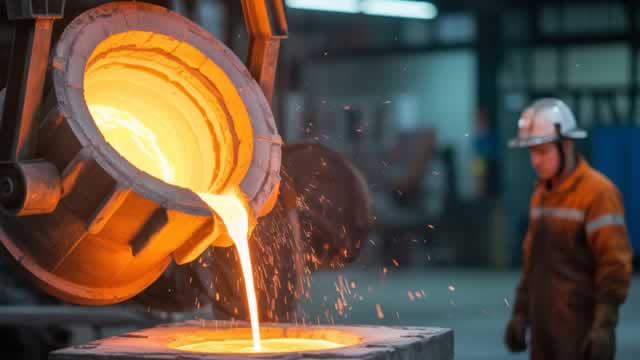
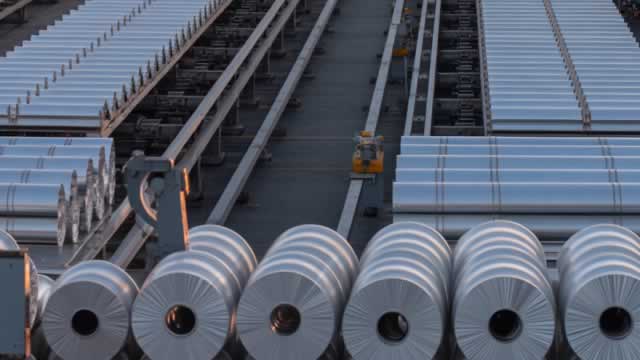
Constellium SE, along with its various subsidiaries, specializes in the development, production, and distribution of high-performance rolled and extruded aluminum solutions. These solutions primarily serve the packaging, aerospace, and automotive industries. Its operations are structured into three distinct business segments: Packaging & Automotive Rolled Products, Aerospace & Transportation, and Automotive Structures & Industry. The Packaging & Automotive Rolled Products division manufactures rolled aluminum materials. This includes stock for beverage and food cans and closures, as well as foil for flexible packaging applications. Additionally, this segment provides crucial components for the automotive sector, such as body sheets and heat exchangers, alongside specialized reflective sheets. Within the Aerospace & Transportation segment, the company supplies an array of rolled aluminum products. These encompass plates, sheets, and extrusions specifically tailored for aerospace applications, including wing skins. Furthermore, it delivers plates and sheets for various transportation, industrial, and defense uses. The Automotive Structures & Industry division is responsible for advanced extruded products and structural components designed for the automotive sector. Its offerings include critical items like crash-management systems, body structures, side impact beams, and battery enclosures. It also produces both hard and soft alloy extruded profiles utilized across diverse industrial contexts, spanning automotive, engineering, rail, and other transport-related markets. Beyond manufacturing, this segment delivers value-added downstream services such as pre-machining, surface treatment, research and development, and comprehensive technical support. Constellium distributes its products either directly to customers or via a network of distributors. Its global footprint includes sales operations in European nations such as France, Germany, the Czech Republic, the United Kingdom, and Switzerland, as well as in the United States, Shanghai, and Seoul. Established in 2010, Constellium SE maintains its corporate headquarters in Paris, France.
常规交易时段
US$25.605
−US$0.205 · -0.79%
盘中时间采用ET。市场数据可能有所延迟。
Constellium SE, along with its various subsidiaries, specializes in the development, production, and distribution of high-performance rolled and extruded aluminum solutions. These solutions primarily serve the packaging, aerospace, and automotive industries. Its operations are structured into three distinct business segments: Packaging & Automotive Rolled Products, Aerospace & Transportation, and Automotive Structures & Industry. The Packaging & Automotive Rolled Products division manufactures rolled aluminum materials. This includes stock for beverage and food cans and closures, as well as foil for flexible packaging applications. Additionally, this segment provides crucial components for the automotive sector, such as body sheets and heat exchangers, alongside specialized reflective sheets. Within the Aerospace & Transportation segment, the company supplies an array of rolled aluminum products. These encompass plates, sheets, and extrusions specifically tailored for aerospace applications, including wing skins. Furthermore, it delivers plates and sheets for various transportation, industrial, and defense uses. The Automotive Structures & Industry division is responsible for advanced extruded products and structural components designed for the automotive sector. Its offerings include critical items like crash-management systems, body structures, side impact beams, and battery enclosures. It also produces both hard and soft alloy extruded profiles utilized across diverse industrial contexts, spanning automotive, engineering, rail, and other transport-related markets. Beyond manufacturing, this segment delivers value-added downstream services such as pre-machining, surface treatment, research and development, and comprehensive technical support. Constellium distributes its products either directly to customers or via a network of distributors. Its global footprint includes sales operations in European nations such as France, Germany, the Czech Republic, the United Kingdom, and Switzerland, as well as in the United States, Shanghai, and Seoul. Established in 2010, Constellium SE maintains its corporate headquarters in Paris, France.
日内区间
当前US$25.605
52周区间
当前US$25.605
盘中时间采用ET。市场数据可能有所延迟。
Constellium SE, along with its various subsidiaries, specializes in the development, production, and distribution of high-performance rolled and extruded aluminum solutions. These solutions primarily serve the packaging, aerospace, and automotive industries. Its operations are structured into three distinct business segments: Packaging & Automotive Rolled Products, Aerospace & Transportation, and Automotive Structures & Industry. The Packaging & Automotive Rolled Products division manufactures rolled aluminum materials. This includes stock for beverage and food cans and closures, as well as foil for flexible packaging applications. Additionally, this segment provides crucial components for the automotive sector, such as body sheets and heat exchangers, alongside specialized reflective sheets. Within the Aerospace & Transportation segment, the company supplies an array of rolled aluminum products. These encompass plates, sheets, and extrusions specifically tailored for aerospace applications, including wing skins. Furthermore, it delivers plates and sheets for various transportation, industrial, and defense uses. The Automotive Structures & Industry division is responsible for advanced extruded products and structural components designed for the automotive sector. Its offerings include critical items like crash-management systems, body structures, side impact beams, and battery enclosures. It also produces both hard and soft alloy extruded profiles utilized across diverse industrial contexts, spanning automotive, engineering, rail, and other transport-related markets. Beyond manufacturing, this segment delivers value-added downstream services such as pre-machining, surface treatment, research and development, and comprehensive technical support. Constellium distributes its products either directly to customers or via a network of distributors. Its global footprint includes sales operations in European nations such as France, Germany, the Czech Republic, the United Kingdom, and Switzerland, as well as in the United States, Shanghai, and Seoul. Established in 2010, Constellium SE maintains its corporate headquarters in Paris, France.
日内区间
当前US$25.605
52周区间
当前US$25.605
盈利能力占已公布营收的百分比。
营收
营业利润
净利润
| 项目(USD) | 2025财年 | 2024财年 | 2023财年 | 2022财年 | 2021财年 |
|---|---|---|---|---|---|
| 营收 | 84.49亿 USD | 70.83亿 USD | 71.11亿 USD | 79.29亿 USD | 69.65亿 USD |
| 销货成本 | 75.92亿 USD | 61.78亿 USD | 61.53亿 USD | 70.34亿 USD | 62.14亿 USD |
| 毛利 | 8.57亿 USD | 9.06亿 USD | 9.59亿 USD | 8.95亿 USD | 7.52亿 USD |
| 研究与开发 | 5100万 USD | 4731.93万 USD | 4725.23万 USD | 4274.64万 USD | 4415.66万 USD |
| 销售、一般及管理费用 | 3.32亿 USD | 3.02亿 USD | 2.88亿 USD | 2.64亿 USD | 2.92亿 USD |
| 营业费用 | 3.83亿 USD | 6.43亿 USD | 6.08亿 USD | 5.76亿 USD | 2.04亿 USD |
| 利息收入 | — | — | 1600万 USD | — | — |
| 利息支出 | 1.14亿 USD | 1.12亿 USD | 1.15亿 USD | 1.26亿 USD | 1.55亿 USD |
| 折旧和摊销 | 3.3亿 USD | 2.94亿 USD | 2.75亿 USD | 2.87亿 USD | 3.02亿 USD |
| 营业利润 | 4.74亿 USD | 2.63亿 USD | 3.51亿 USD | 3.19亿 USD | 5.48亿 USD |
| 净利润 | 2.73亿 USD | 5407.92万 USD | 1.38亿 USD | 2.86亿 USD | 2.91亿 USD |
公司数据更新于 2026年10月12日。
近期已公布业绩
近期已公布业绩
第三方分析师预期可能变化,并非 GoAI 建议。
报告持有此股票敞口的交易所交易基金。
 iShares Russell 2000 ETFIWM8590.71万0.11%787.4亿 USD0.19%US$278.18-0.27%
 Avantis International Small Cap Value ETFAVDV6450.56万0.32%200.38亿 USD0.36%US$108.15-0.34%
 iShares Russell 2000 Growth ETFIWO3024.68万0.22%139.17亿 USD0.24%US$355.03-0.49%
 Vanguard Russell 2000 ETFVTWO2058.23万0.11%180亿 USD0.06%US$112.37-0.26%
 Vanguard Materials ETFVAW951.5万0.21%45亿 USD0.09%US$221.29-0.13%
 Avantis International Equity ETFAVDE918.13万0.05%192.24亿 USD0.23%US$89.705-0.11%
 Principal U.S. Small-Cap Multi-Factor ETFPSC805.69万0.30%27亿 USD0.38%US$67.625-0.11%
 Janus Henderson Small/Mid Cap Growth Alpha ETFJSMD583.5万0.56%10.5亿 USD0.30%US$90.78-0.72%iShares Russell 2000 ETFIWMAvantis International Small Cap Value ETFAVDViShares Russell 2000 Growth ETFIWOVanguard Russell 2000 ETFVTWOVanguard Materials ETFVAWAvantis International Equity ETFAVDEPrincipal U.S. Small-Cap Multi-Factor ETFPSCJanus Henderson Small/Mid Cap Growth Alpha ETFJSMD
AI 生成内容及延迟市场数据仅供信息与教育用途,不构成投资建议。